Gold begins this forecast period consolidating just below the $4,750 level, having absorbed a week of mixed economic signals and shifting central bank expectations. The precious metal’s ability to hold near multi-week highs reflects underlying safe-haven demand, but the immediate path hinges on a crucial batch of US inflation data and its implications for Federal Reserve policy. This gold price forecast next week will dissect the key technical battlegrounds, the high-impact economic events on the calendar, and outline the most probable trading scenarios for XAU/USD between April 12 and April 18, 2026. We will provide a clear framework for both bullish and bearish outcomes, anchored by precise price targets derived from our chart analysis.
Last Week in Review: Gold Holds Gains Amid Policy Uncertainty
The week of April 5–10, 2026, saw gold extend its consolidation phase within a relatively tight range, demonstrating resilience despite fluctuating risk sentiment. The market primarily grappled with conflicting narratives from Federal Reserve officials. Hawkish remarks from several regional Fed presidents, emphasizing the need to guard against persistent inflationary pressures, initially capped upside momentum. However, these were counterbalanced by more cautious tones from other members, who pointed to emerging softness in the labor market and consumer spending as reasons to avoid further tightening.
The release of the FOMC meeting minutes from March provided little new direction, largely reiterating the committee’s data-dependent stance. Market participants parsed every word for clues on the timing of a potential rate cut, but the minutes offered no clear timeline, leaving Treasury yields and the US Dollar Index (DXY) in a state of limbo. This uncertainty proved to be a net positive for non-yielding gold, as it removed a clear bearish catalyst. Geopolitical tensions, particularly renewed friction in the South China Sea and a stalemate in Eastern European peace talks, provided a consistent, low-level bid for safe-haven assets throughout the week. By Friday’s close, gold had managed to eke out a minor weekly gain, settling just below the $4,750 handle, setting the stage for this week’s critical data tests.
Next Week Economic Calendar & Impact
The upcoming week’s economic docket is dominated by top-tier US inflation data, which will be the primary driver for gold prices. The market’s interpretation of these numbers—whether they signal a re-accelerating or moderating inflation trend—will directly influence Fed rate expectations and, by extension, the US dollar and real yields.
- Tuesday, April 14: US Producer Price Index (PPI) – This wholesale inflation gauge is a leading indicator for consumer prices. A hotter-than-expected PPI print would fuel concerns about upstream price pressures, likely boosting the dollar and Treasury yields, creating a headwind for gold. Conversely, a cooler PPI reading would reinforce the disinflation narrative, weakening the dollar and supporting a gold price forecast next week geared towards higher levels.
- Wednesday, April 15: US Consumer Price Index (CPI) – The week’s marquee event. The core CPI (excluding food and energy) is the Fed’s preferred inflation measure. A strong beat on both headline and core CPI would be unequivocally hawkish, pushing rate cut expectations further into the future and triggering a likely sharp sell-off in gold towards our outlined support targets. A significant miss or in-line reading would be viewed as dovish, potentially unleashing the next leg higher for XAU/USD as markets price in earlier policy easing.
- Thursday, April 16: US Retail Sales & Initial Jobless Claims – These reports provide a pulse check on the US consumer and labor market. Strong Retail Sales coupled with low Jobless Claims would suggest economic resilience, allowing the Fed to maintain a restrictive stance (bearish for gold). Weakness in either would signal economic cooling, increasing the urgency for rate cuts (bullish for gold).
- Friday, April 17: US Building Permits / Housing Starts & University of Michigan Consumer Sentiment (Prelim) – The housing data impacts growth outlooks, while the sentiment index includes inflation expectations. Rising inflation expectations in the survey could spook markets, even if hard data is soft.
Traders should also monitor speeches from Fed officials, which are likely to amplify the market’s reaction to the data throughout the week.
Technical Analysis
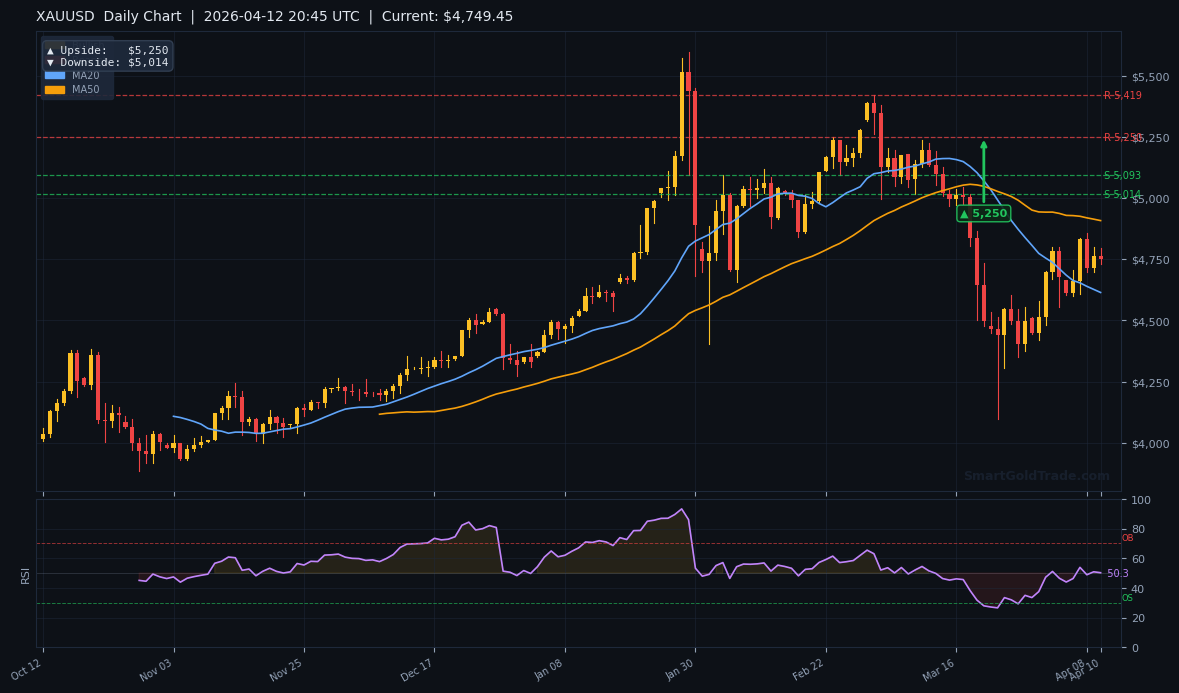
The technical picture for gold presents a clear battle between immediate-term consolidation and a broader bullish structure. On the daily chart, the metal remains firmly above its key rising moving averages (50, 100, and 200-day), confirming the primary uptrend is intact. However, momentum, as indicated by the Relative Strength Index (RSI), is hovering near 60, which suggests the market is not overbought but is encountering some resistance to further immediate gains.
The more granular view is provided by our shorter-timeframe charts. The 4-hour chart reveals a contracting price range, with gold coiling between dynamic support and a static resistance zone. A decisive break from this coil will likely dictate the directional bias for the week.
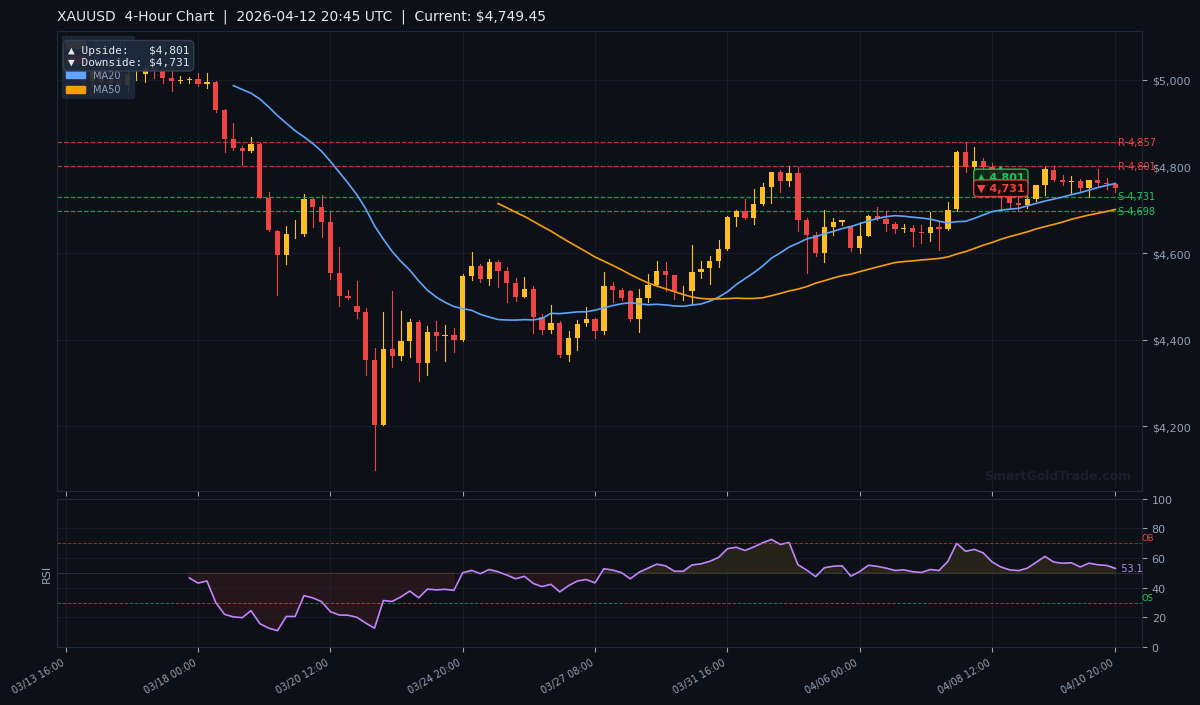
Our 4-hour analysis pinpoints the immediate upside target at $4,801 and the downside target at $4,731. The $4,800 region represents a significant psychological and technical barrier that has capped rallies on multiple occasions recently. A sustained break above this level would open the path toward the daily chart’s more ambitious target of $5,250. On the flip side, a failure to hold above the 4-hour support at $4,731 would signal a deeper corrective move is underway, initially targeting the $4,744 area on the 1-hour chart and potentially extending toward the daily downside target of $5,014.
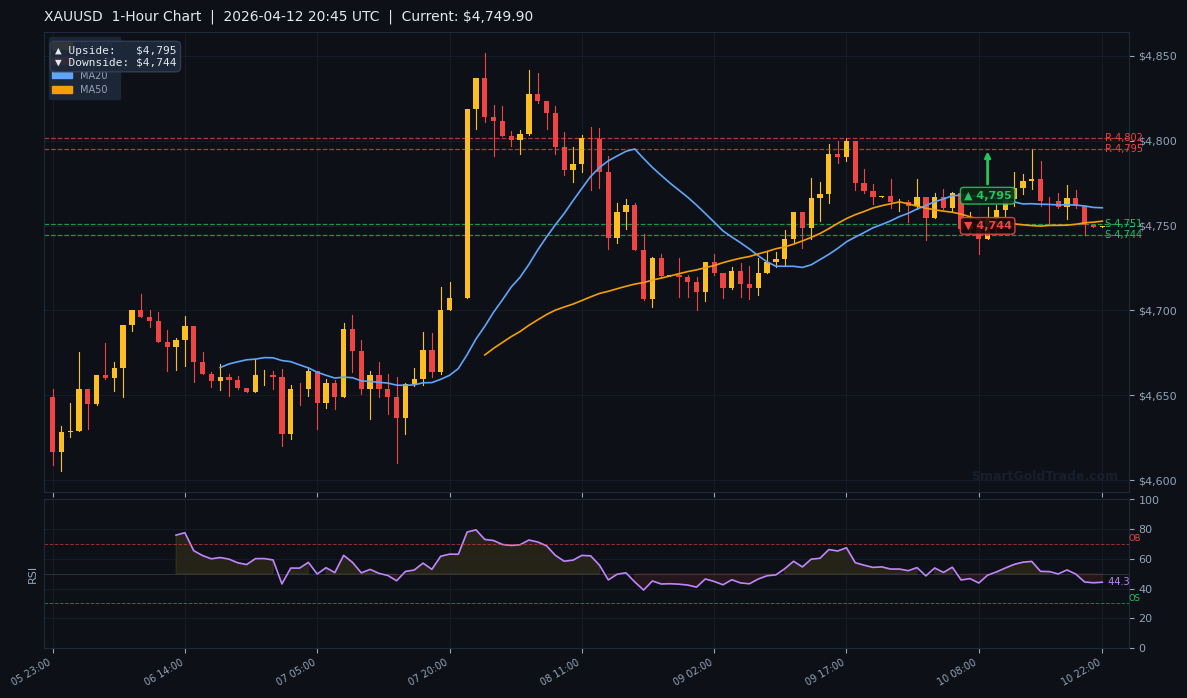
The 1-hour chart offers the tightest levels for intraday traders, defining the micro battle zone. The upside target is set at $4,795, just shy of the 4-hour resistance, while the downside target sits at $4,744. A break below $4,744 on the 1-hour frame would likely trigger a cascade of stop-loss orders, accelerating a move down to test the 4-hour support at $4,731. For investors considering a longer-term position in physical gold as a store of value during this period of uncertainty, our certified gold coins and bars offer a tangible hedge against market volatility.
Trading Scenarios
Bull Scenario (Probability: 55%)
The bull case for this gold price forecast next week materializes if the US inflation data (CPI and PPI) come in at or below consensus expectations. This would be interpreted as a clear sign that disinflation is progressing, reviving market bets on an imminent Fed rate cut. Such a scenario would likely trigger a simultaneous drop in the US dollar and US Treasury yields, the two main headwinds for gold. Under these conditions, we anticipate XAU/USD will muster the bullish momentum needed to challenge and break above the formidable $4,800 resistance cluster.
The initial price objective would be a test of the 4-hour upside target at $4,801. A decisive weekly close above this level would confirm the breakout and set the stage for a more extended rally, with the next major focus becoming the daily chart’s target of $5,250. This scenario would also be fueled by any unexpected geopolitical escalation, which would amplify safe-haven flows into the metal.
Bear Scenario (Probability: 45%)
The bearish scenario gains traction if inflation data surprises to the upside, indicating that price pressures are more stubborn than anticipated. A hot CPI print, in particular, would force a dramatic repricing of Fed policy, pushing the first expected rate cut further into 2026 or even reviving talks of a potential hike. This would send the US dollar soaring and bond yields spiking, creating a powerfully negative environment for gold.
In this case, gold would likely fail at the $4,795-$4,801 resistance zone and begin a corrective decline. The first line of defense would be the 1-hour downside target at $4,744. A breach here would quickly open the path to the 4-hour support target at $4,731. If selling intensifies, the correction could extend further to test the deeper daily framework support at $5,014. This scenario underscores the importance of having robust risk management tools. For traders using automated systems, employing a news event trading protection bot can be crucial to pause strategies during these high-volatility data releases, protecting capital from whipsaw price action.
Key Takeaways
- Inflection Point: This week’s US CPI and PPI data are the definitive catalysts that will break gold out of its current consolidation range and set the directional tone.
- Critical Resistance: The $4,795-$4,801 zone is the key technical hurdle for bulls. A confirmed break above it opens the door to a significant rally.
- Immediate Support: The $4,731-$4,744 band must hold to prevent a deeper technical correction towards the $5,014 area.
- Macro Driver: The market’s reaction will hinge entirely on how the data alters Federal Reserve interest rate expectations. Softer inflation = bullish gold; hotter inflation = bearish gold.
- Risk Management is Paramount: Given the high-impact nature of the scheduled events, traders should reduce leverage, widen stops, or consider standing aside until the initial volatility subsides.
- Long-Term Trend Intact: Regardless of the week’s outcome, the primary daily trend for gold remains bullish above its key moving averages.
Conclusion
The upcoming week presents a classic macro-driven setup for gold. Prices are coiled just beneath a major technical resistance level, awaiting a fundamental spark. The March US inflation reports will provide that spark, determining whether gold has the fuel to finally achieve a sustainable breakout above $4,800 or is forced into a meaningful corrective pullback. Our analysis suggests a slight edge to the bullish case, contingent on inflation not re-accelerating. However, traders must remain agile. The most prudent approach is to wait for the market’s unambiguous reaction to the CPI data on Wednesday before committing to significant directional positions. By focusing on the clearly defined technical levels of $4,801 and $4,731, traders can objectively assess the market’s next move. This disciplined, level-based approach is essential for navigating the potentially volatile but opportunity-rich environment outlined in this gold price forecast next week.
FAQ
Q: What is the most important data point for gold next week?
A: The US Consumer Price Index (CPI) report on Wednesday, April 15, is overwhelmingly the most critical event. It is the primary gauge of inflation used by the Federal Reserve and will directly shape interest rate expectations, which are the main driver of gold prices in the current environment.
Q: If I’m bullish on gold long-term but worried about short-term volatility, what’s a good strategy?
A: For long-term investors, short-term volatility can be navigated by dollar-cost averaging into positions or by utilizing managed gold trading plans where professional managers handle the timing and risk. This allows you to maintain exposure to gold’s long-term upside while mitigating the impact of weekly news-driven swings.
Q: What happens to gold if the CPI data is exactly in line with expectations?
A: An in-line CPI print would likely cause initial volatility as algorithms react, but could ultimately lead to a “buy the rumor, sell the fact” scenario if the market has already priced in a dovish outcome. The focus would then shift to other data (Retail Sales, Jobless Claims) and technical breaks above $4,800 or below $4,731 for the next directional cue.