
Our gold price forecast next week is shaped by a potent mix of surging inflation, escalating trade wars, and a weakening US Dollar. XAU/USD is trading at $4,749.90 per ounce as of April 11, 2026, advancing for the second consecutive week. The week ahead (April 14–18) is packed with high-impact data and geopolitical crosscurrents that could be the catalyst for a decisive break above $5,000.
Below we recap what drove markets this past week, analyse the key technical levels, and walk through every major event on the calendar for the week of April 14–18.
Last Week in Review: April 7–11, 2026
Gold started the week on the back foot, dipping to $4,645 on Monday as profit-taking emerged after the all-time high of $5,602 set in January 2026. However, sellers could not sustain the momentum, and buyers stepped back in consistently throughout the week, pushing XAU/USD back toward $4,750 by Friday.
US CPI Surprise: Inflation Jumps to 3.3%
The headline event of the week was Thursday's US Consumer Price Index report for March 2026. Headline CPI printed at 3.3% year-on-year, a sharp spike from 2.4% in February. The primary culprit was energy: gasoline prices surged nearly 11% month-on-month as Middle East conflict choked crude oil supply through the Strait of Hormuz.
Despite the hot print, gold barely flinched. Federal Reserve Chair Jerome Powell stated the Fed's tendency is to "look through any kind of a supply shock," anchoring inflation expectations and preventing a hawkish repricing of rate-cut odds. This dovish interpretation kept the US Dollar under pressure and provided a strong floor for gold prices.
GDP and Labour Market Signal Slowdown
Additional macro data reinforced the stagflation narrative. The final Q4 2025 GDP print came in at a weak 0.5% annualized, revised down from the prior estimate of 0.7%. Meanwhile, weekly jobless claims rose to 219,000 — above the 210,000 consensus — signalling a gradual cooling in the US labour market. Slower growth combined with rising prices is a classically gold-bullish backdrop.
US-Iran Ceasefire Talks and Geopolitical Tension
US-Iran ceasefire negotiations added volatility throughout the week. When headlines indicated early progress in talks, the Dollar briefly recovered and gold pulled back. However, no agreement was reached, keeping energy prices and safe-haven demand elevated. The ongoing uncertainty around the Strait of Hormuz remains a live geopolitical risk premium heading into next week.
US–China Tariff War Intensifies
The broader geopolitical backdrop was dominated by the escalating US-China trade war. US tariffs on Chinese goods stand at 145%, with Beijing retaliating at 125% on American imports. This mutual tariff standoff is generating stagflationary pressures globally — rising input costs meeting slowing growth — a combination that historically drives strong demand for gold as a store of value.
Market Context: The Macro Backdrop for Gold
Gold's current position reflects a powerful confluence of macroeconomic forces. The metal has staged a significant rally, recovering from its all-time high of $5,602 set in January 2026 after a sharp correction. This recovery is primarily driven by shifting global risk dynamics, persistent dollar weakness, and accelerating central bank buying.
Investors are navigating a complex landscape of policy uncertainty and market volatility. The primary theme is a search for stability amid conflicting economic signals. This backdrop is fundamentally supportive for non-yielding, safe-haven assets like gold.
Technical Analysis and Critical Price Levels
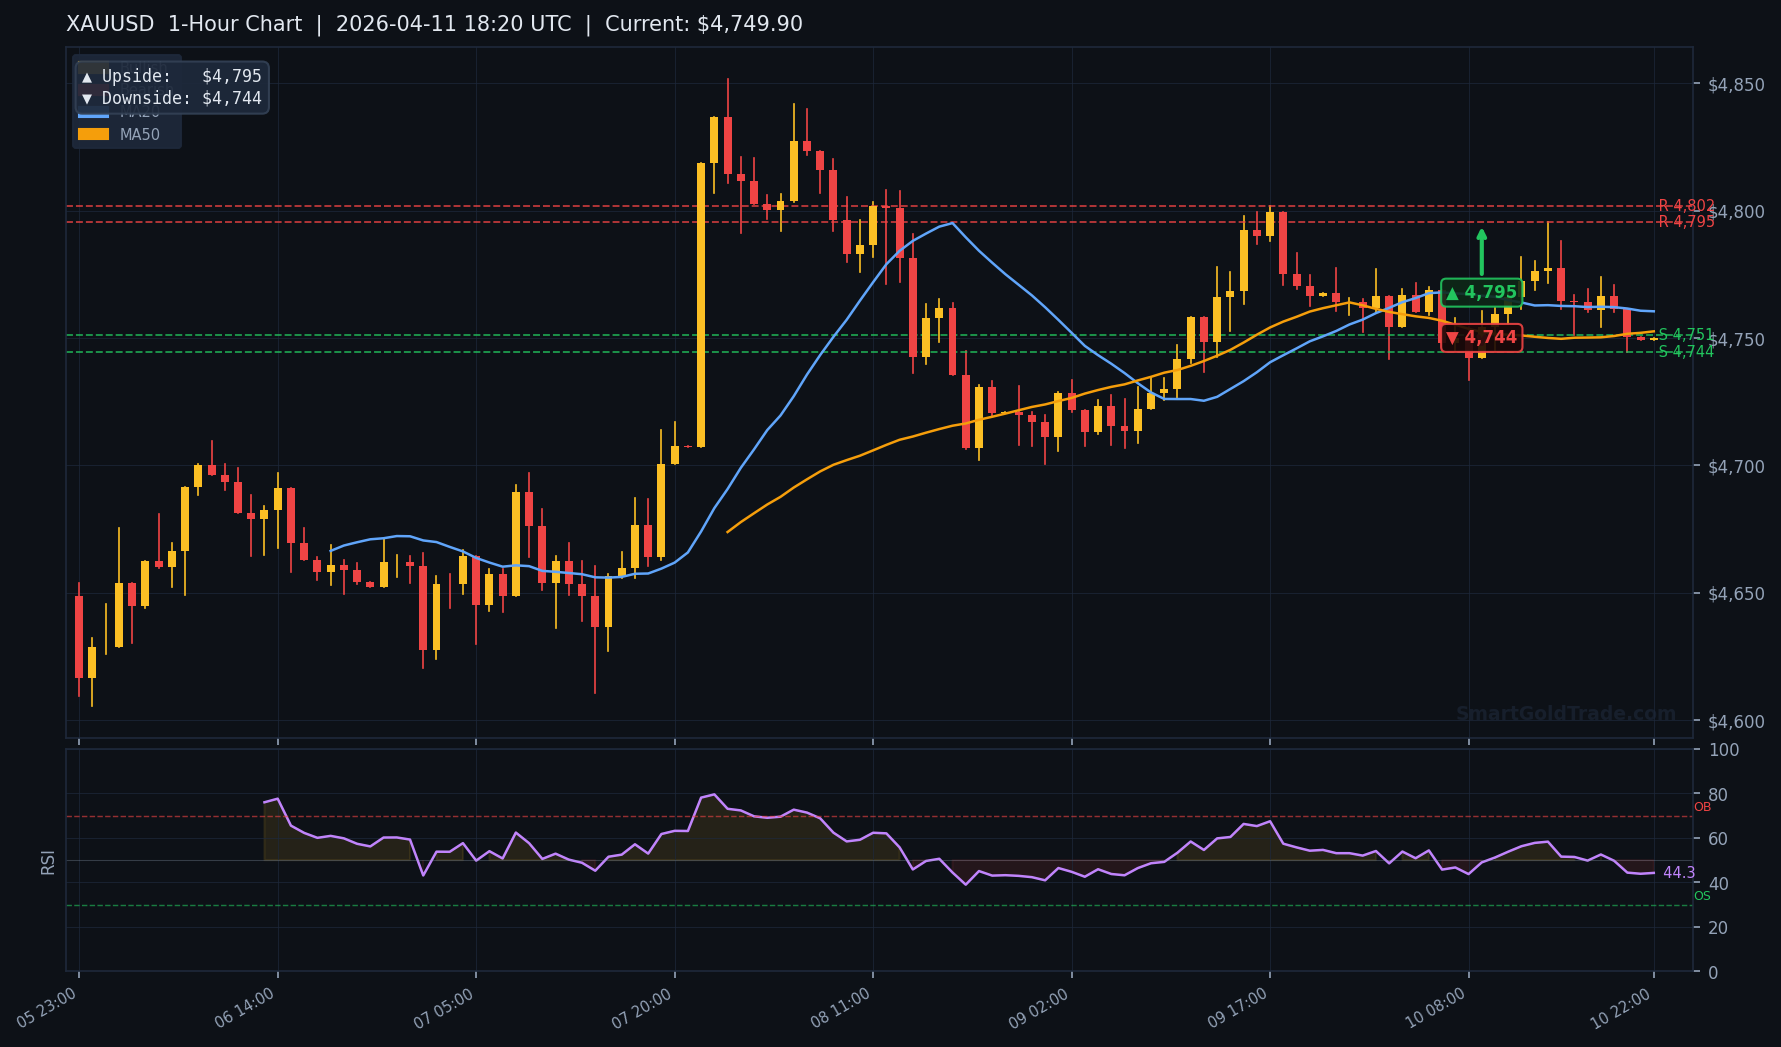
The technical picture for XAU/USD provides a clear roadmap for traders. The current price of $4,749.90 sits just below a major resistance zone. A decisive break above or rejection from this area will dictate the short-term trend.
Key moving averages confirm the bullish underlying structure. The 20-day MA is at $4,620, providing dynamic support. The 50-day MA sits lower at $4,480, a strong base for any deeper pullback.
Resistance: The Path to $5,000
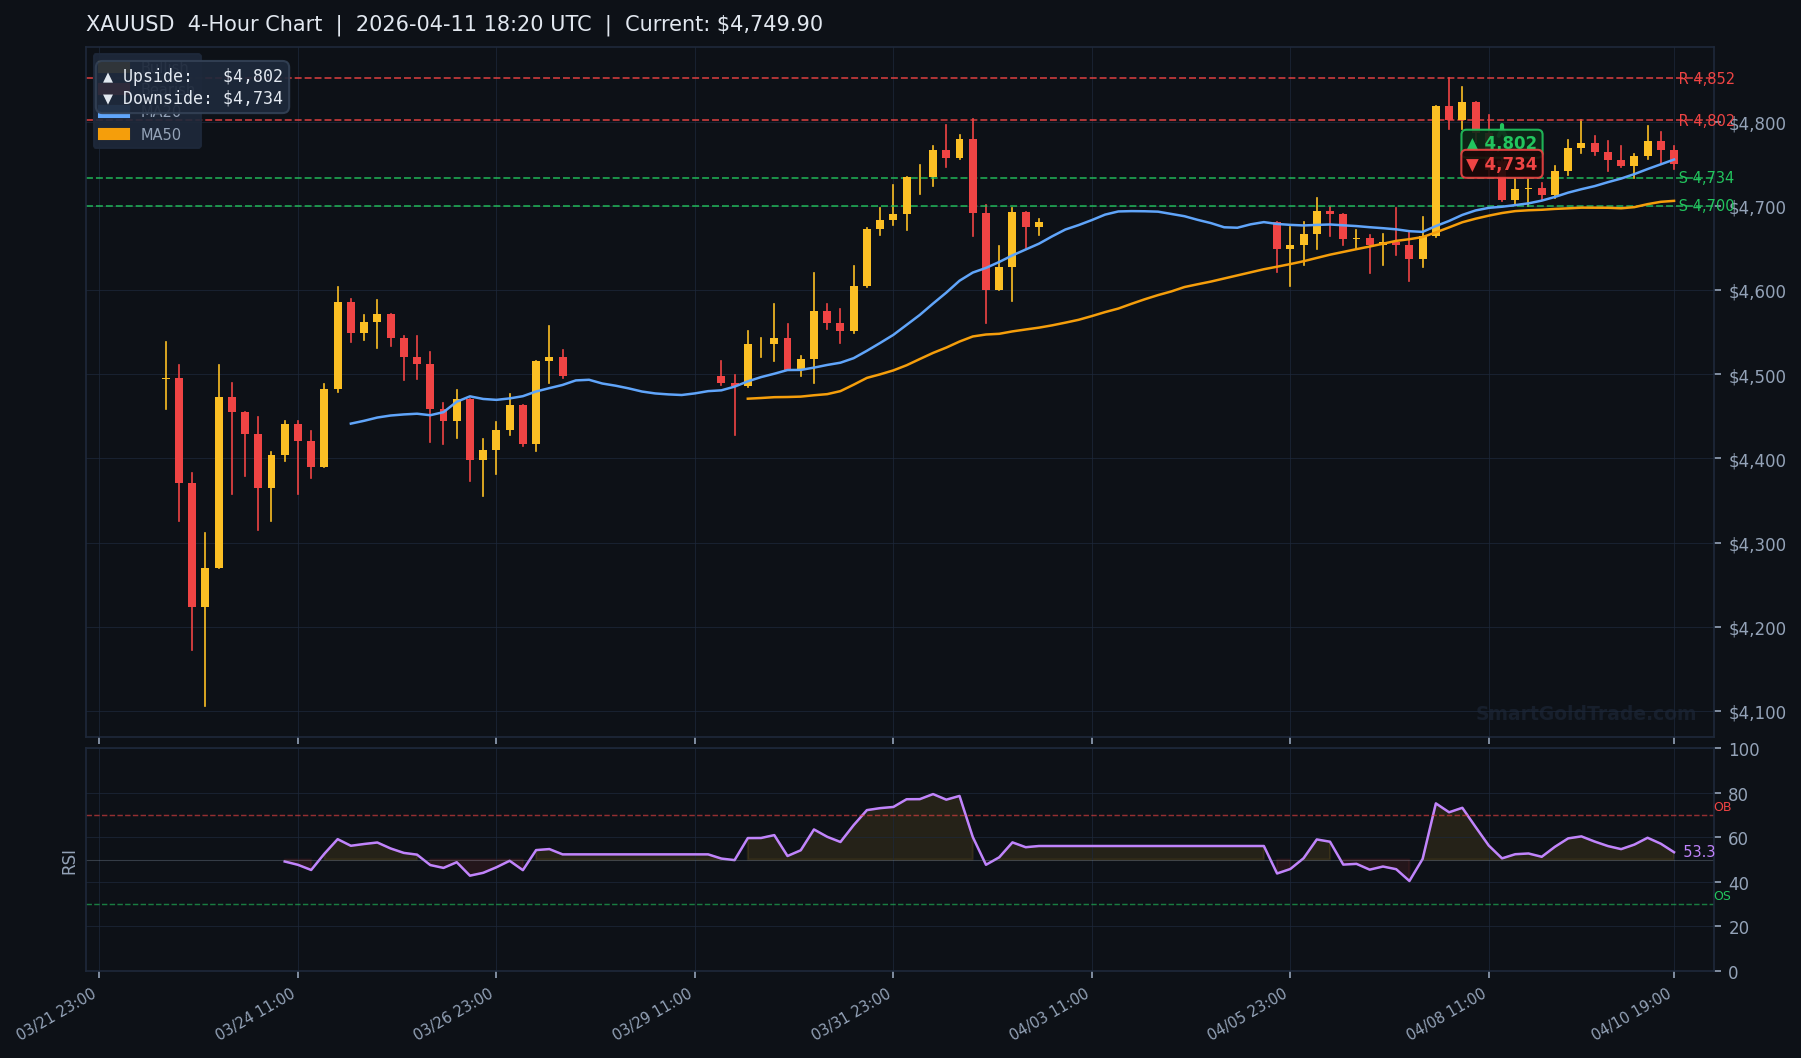
Immediate resistance is firm at the recent swing high of $4,852. A daily close above this level would signal a breakout. The next major target is the psychological $5,000 barrier, followed by a supply zone at $5,050–$5,100.
The RSI on the daily chart reads a neutral 57, indicating significant room for upward momentum before becoming overbought. The H4 chart shows an upside pivot target at $4,802 as the first gate; the daily chart projects a longer-term upside target of $5,284 on a sustained breakout above $4,852.
Support: Zones to Watch for Pullbacks
The first key support is at the weekly open near $4,680. This level must hold to maintain the immediate bullish bias. A break below could see a test of the stronger $4,580 zone, where the 50-day MA and key structure converge.
The H4 downside pivot target sits at $4,734. A daily close below $4,680 would shift the short-term outlook to neutral and open the $4,580 area for a deeper test.
Fundamental Drivers and News Impact
Gold is being pulled by opposing forces. On one side, aggressive central bank buying and geopolitical tensions provide a solid floor. On the other, Fed policy signals and Treasury yield volatility create sharp moves around key levels.
Central Bank Policy and the US Dollar
The Federal Reserve's response to the CPI spike was deliberately dovish — Powell explicitly said the Fed would look through tariff-driven supply shocks. Markets are pricing in roughly two rate cuts by year-end 2026. This expectation is a direct headwind for the Dollar and tailwind for gold.
The US Dollar Index (DXY) is hovering near 99.8, a multi-year low. Dollar weakness is a direct tailwind for dollar-denominated gold. Any sustained recovery in the DXY above 101 would be the main headwind for XAU/USD next week.
Persistent central bank buying from China, India, and Turkey continues. The pace of purchases has more than doubled relative to the 2015–19 average, providing structural support and absorbing selling pressure.
Geopolitical and Yield Dynamics
US-Iran ceasefire talks remain unresolved, keeping energy prices and risk premiums elevated. Russia-Ukraine ceasefire talks have also stalled. These unresolved conflicts keep a steady bid under safe-haven assets — any fresh escalation would trigger a rapid flight to quality directly benefiting gold.
The 10-year Treasury yield is volatile near 4.48%. Rising real yields increase the opportunity cost of holding gold. Conversely, any fall in yields — likely if this week's economic data disappoints — makes non-yielding bullion more attractive.
Trading Strategy and Weekly Outlook
Our gold price forecast next week assigns probabilities to three main scenarios. The bullish case carries a 60% probability, the bearish case 25%, and sideways consolidation 15%.
Bullish Scenario (60% Probability)
A decisive break above $4,852 opens the path towards $5,000–$5,050. Catalysts include softer US Retail Sales, dovish signals from Fed Governors Waller or Bostic, weak China GDP, or escalation in Strait of Hormuz tensions. A daily close above $4,860 confirms the breakout.
For those looking to position for the gold bull run, our mudarabah investment plans offer a Shariah-compliant path to gold exposure.
Bearish and Sideways Scenarios
The bearish scenario involves a rejection at $4,852 and a pullback to $4,680–$4,734. Catalysts: strong Retail Sales, DXY recovery above 101, or a US-Iran ceasefire breakthrough reducing the geopolitical risk premium. A break below $4,680 opens the H4 downside target of $4,734 and the $4,580 zone beyond.
The sideways scenario sees consolidation between $4,680 and $4,852, driven by conflicting data and pre-holiday indecision. Good Friday's market closure on April 18 will compress all active trading into just four days, amplifying any move that does occur.
Key Economic Events: April 14–18 Calendar
The economic calendar is critical for this gold price forecast next week. High-impact events can override technical setups. Friday is a US market holiday — all of the week's volatility will be compressed into four trading days.
- Monday, April 14: China Q1 2026 GDP (Expected: 5.1%). A miss could spur global growth fears and safe-haven flows into gold — particularly significant given last week's weak US GDP data.
- Tuesday, April 15: US Empire State Manufacturing Index. Speeches from Fed Governors Waller and Bostic — any hint of accelerated rate cuts would weaken the Dollar and boost gold.
- Wednesday, April 16: US Retail Sales (March) and FOMC Beige Book. The week's most important release. Following last week's weak GDP (0.5%) and rising jobless claims (219K), a soft Retail Sales print would confirm the slowdown narrative and propel gold higher.
- Thursday, April 17: US Initial Jobless Claims and Philadelphia Fed Manufacturing Index. A further rise in claims above last week's 219K would reinforce labour market weakness and support gold.
- Friday, April 18: Good Friday — US markets CLOSED. Thin, erratic liquidity is likely. Adjust position sizes and secure partial profits before the holiday.
Managing risk during these high-impact announcements is crucial. Utilizing tools like a news event trading protection bot can help automate pauses during volatile releases, protecting capital from erratic spikes.
Key Takeaways
- Gold advanced for the second consecutive week, with XAU/USD at $4,749.90 as of April 11, 2026.
- Last week's CPI jumped to 3.3% (from 2.4%), driven by a gasoline surge (+11%) tied to Strait of Hormuz tensions — gold-bullish as the Fed looks through it.
- Weak US GDP (0.5% annualised) and rising jobless claims (219K) reinforce the stagflation narrative that structurally supports gold.
- US-China tariffs at 145% vs 125% and unresolved US-Iran talks maintain elevated safe-haven demand.
- The bullish scenario (target $5,000–$5,050) has 60% probability, hinging on a break above $4,852.
- This week: China GDP (Mon), US Retail Sales (Wed), Fed speakers — all compressed into four days before Good Friday.
Conclusion
Our gold price forecast next week highlights a market poised for a potential breakout above $5,000. The CPI surprise, weak GDP, rising jobless claims, and unresolved geopolitical risks from the trade war and Middle East tensions — all of these factors continue to build the fundamental case for gold. The week of April 14–18 will be the real test: can bulls muster enough momentum above $4,852 to reach that landmark level?
Failure to break higher would lead to healthy consolidation into the $4,680–$4,734 support zone — which would represent a buying opportunity given the strong structural demand. The medium-term gold outlook remains firmly bullish.
For investors looking to convert this analysis into physical ownership, explore our secure vaulting options and purchase physical gold bars and coins directly. Always align your strategy with your own risk tolerance and investment horizon.
Frequently Asked Questions
What happened to gold last week (April 7–11)?
Gold dipped to $4,645 early in the week before recovering to $4,749 by Friday. Key drivers were: US CPI rising to 3.3% (from 2.4%), the Fed's dovish "look-through" response, weak Q4 GDP (0.5%), rising jobless claims (219K), and ongoing US-Iran ceasefire uncertainty. Gold closed higher for the second consecutive week.
What is the main support level for gold next week?
The primary support is the weekly open near $4,680. A stronger confluence zone exists at $4,580, where the 50-day MA and key price structure align. The H4 downside pivot target is $4,734.
What could push gold above $5,000?
A daily close above $4,852 resistance, combined with soft US Retail Sales, dovish Fed commentary, a further DXY decline, or fresh geopolitical escalation (US-Iran, Strait of Hormuz) would be the likely catalysts for a run at $5,000.
How will Good Friday affect gold trading?
With US markets closed on April 18, liquidity will be thin. This can lead to exaggerated price moves and increased slippage. It is prudent to adjust position sizes or secure partial profits ahead of the holiday weekend.