If you’re wondering why gold is trading at $4,308.72 per ounce today and where it might head next, gold trend analysis is the skill that gives you answers. Many retail investors watch the news and feel lost, but you don't have to. By learning to read the market's story through price movement, you can make confident decisions without relying on guesswork.
What Is Gold Trend Analysis and Why Does It Matter?
Gold trend analysis is the practice of studying past and current price movements to determine the market's direction. It helps you answer one simple question: is gold in an uptrend, a downtrend, or moving sideways? When you can label the market correctly, you stop chasing random moves and start aligning your trades with the bigger picture.
Every price swing tells a story. Today's price of $4,308.72 didn't appear out of nowhere—it followed a sequence of rallies and pullbacks that form a structured trend. When you understand that structure, you can anticipate where buyers or sellers are likely to step in next. This isn't about predicting the future; it's about stacking the odds in your favour by trading with the dominant force.
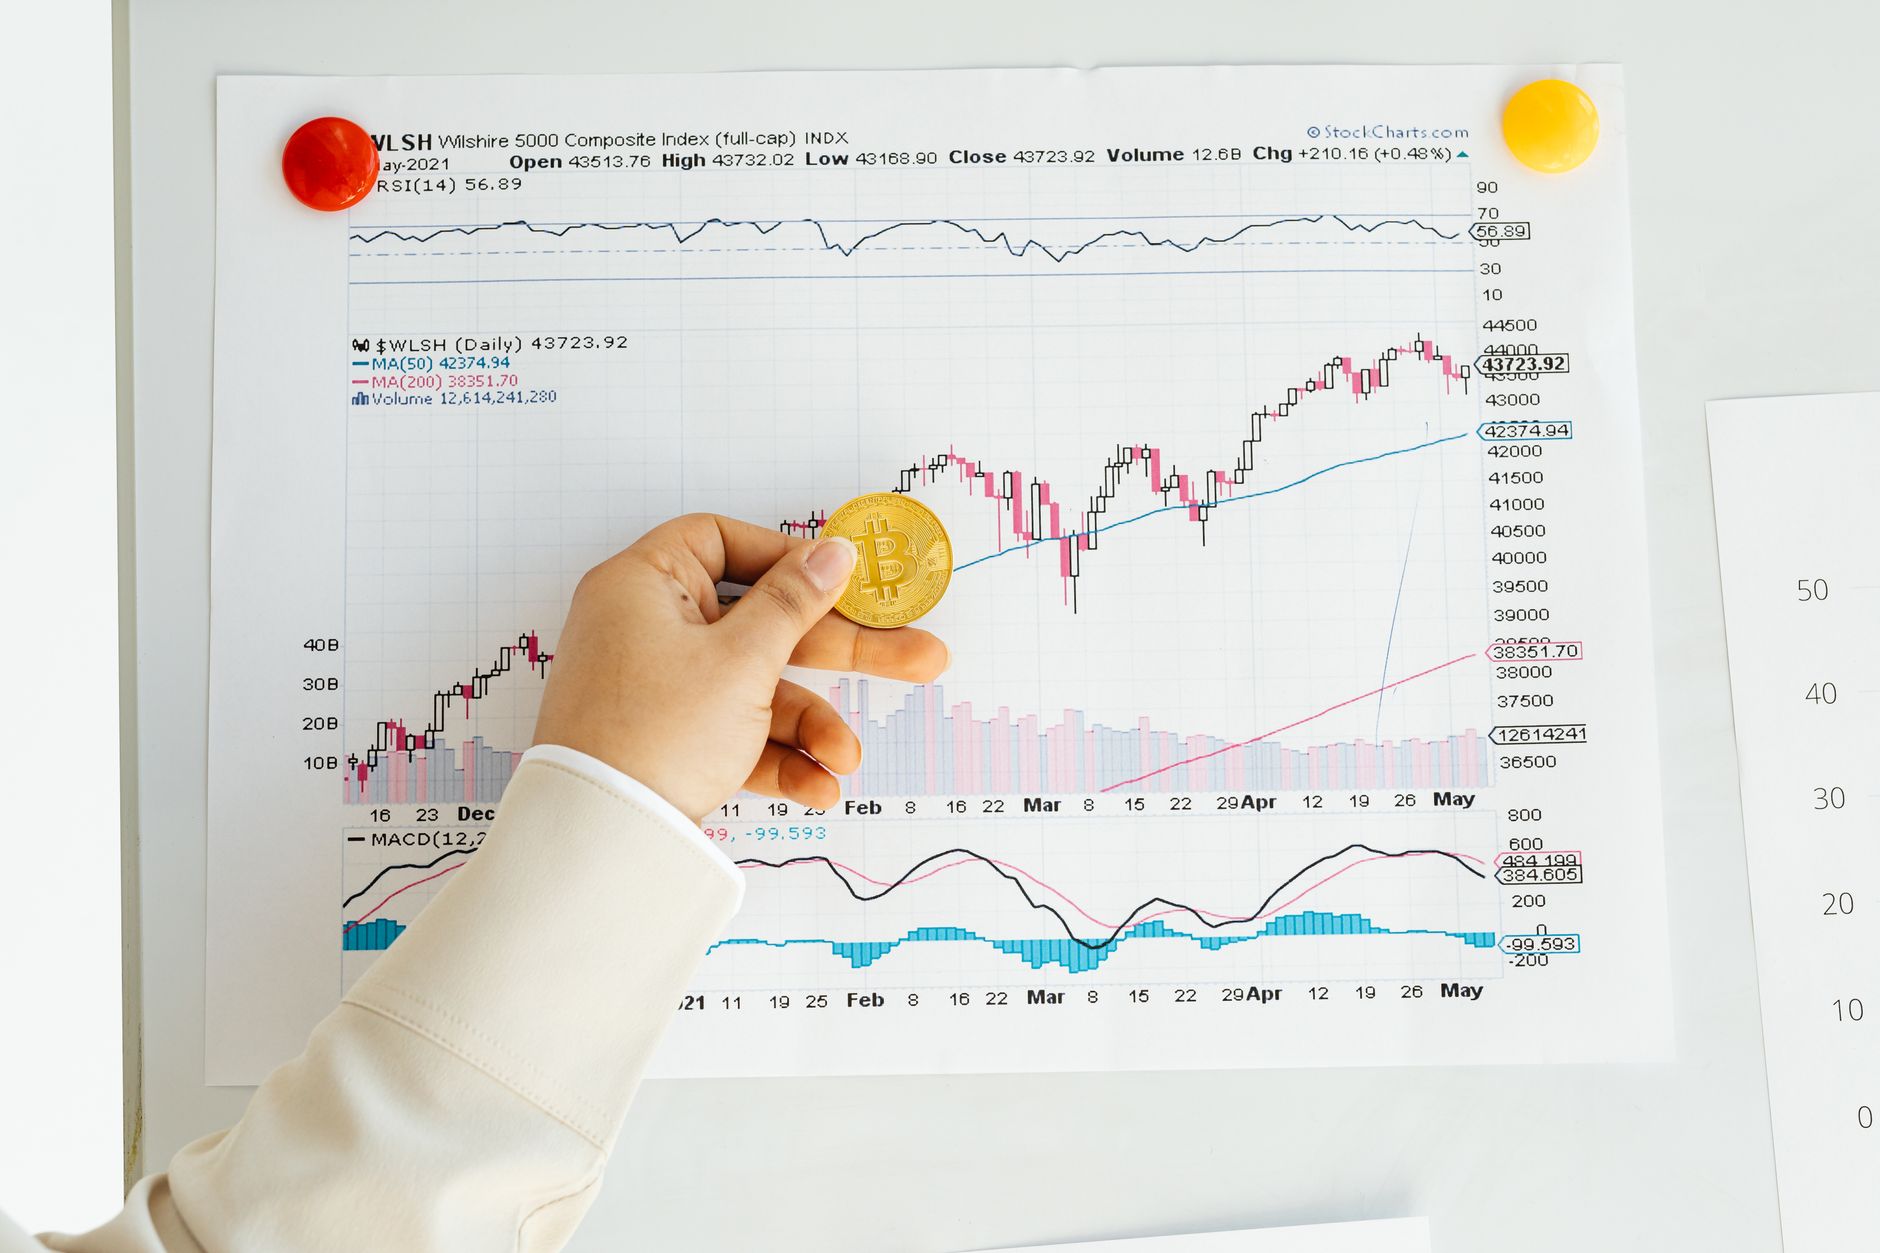
Trend analysis also keeps you out of bad trades. A strong uptrend warns you not to short gold aggressively, while a clear downtrend discourages early bottom-picking. Without this foundation, even the best entry signals fail because you're fighting the market's true direction. On a platform like SmartGoldTrade, you can apply these techniques in a halal gold trading environment with no leverage, letting you focus purely on reading price.
If you'd rather let professionals handle the heavy chart lifting, SmartGoldTrade's copy trading feature lets you mirror veteran gold traders who base every decision on solid trend analysis. It's a practical way to participate in the market while you build your own reading skills.
Identifying the Three Market Phases in Gold
The Uptrend: Higher Highs and Higher Lows
An uptrend forms when each rally surpasses the previous peak, and each pullback stays above the previous trough. Visually, the chart prints a series of higher highs and higher lows. This pattern signals that buyers are consistently willing to pay more, and dip-buyers are absorbing selling pressure at elevated levels.
For example, if gold rose from $4,150 to $4,200, then dipped to $4,180 before rallying to $4,250, you have a higher high ($4,250 > $4,200) and a higher low ($4,180 > $4,150). As long as the structure holds, the uptrend remains intact. Trend followers look to buy near the rising support line or after a pullback to a previous resistance that has turned into support.
Uptrends don't move in straight lines; they breathe. Corrections are normal and often create the best risk‑reward entries. Your job is not to chase every green candle but to wait for a higher low to form before committing capital. That patience is the backbone of solid gold trend analysis.
The Downtrend: Lower Highs and Lower Lows
A downtrend is the mirror image. Each bounce fails to reclaim the previous peak, and each sell‑off breaks below the prior floor. The chart carves a series of lower highs and lower lows, confirming that sellers are in control. If gold drops from $4,300 to $4,260, then retraces to $4,275 before falling to $4,240, you have a lower high ($4,275 < $4,300) and a lower low ($4,240 < $4,260).
Trading against a downtrend is dangerous because bounces often look tempting but trap early bulls. Gold trend analysis teaches you to sell into rallies that approach the declining trend line or a broken support level that has now become resistance. The trend is your friend until the structure changes—until you see a higher low appear on a meaningful timeframe.
Sideways Consolidation: The Range-Bound Market
Sometimes gold moves neither up nor down with conviction. It oscillates between a well‑defined support and resistance, printing roughly equal highs and lows. This is a consolidation phase, often called a range. When you see a flat ceiling and a flat floor, the market is telling you that neither bulls nor bears have the upper hand.
In a range, trend‑following strategies fail if you simply chase trend resumption. Your gold trend analysis should switch gears: buy near the bottom of the range with a tight stop below support, and sell near the top. Once a breakout occurs with momentum—closing above resistance or below support—the market often enters a fresh trend, and you can return to trend‑friendly tactics.
How to Draw Trend Lines Correctly on Gold Charts
A trend line is one of the simplest yet most misunderstood tools. When drawn correctly, it acts as dynamic support or resistance and can last for weeks or months. The rule is straightforward: in an uptrend, connect at least two swing lows, preferably three, angling the line upward. In a downtrend, connect two or more swing highs with a downward sloping line.
Never force the line to touch every wick. A minor overshoot doesn’t invalidate a trend line; what matters is whether the body of the candles respects it more often than not. The more touches you get, the stronger the trend line becomes, and a break of a well‑tested line often signals a potential reversal or acceleration that you can trade.
When drawing an uptrend line, start from the most recent significant low and extend upward through the next higher low. For a downtrend, anchor at the highest high and draw through the next lower high. Avoid fitting a line to the past two weeks and calling it a long‑term trend—zoom out and look for lines that have been in play for months. This big‑picture view is essential for reliable gold trend analysis.
Measuring Trend Strength: Indicators You Can Trust
Average Directional Index (ADX)
The ADX line does not tell you direction; it tells you strength. A reading above 25 suggests a trending market, while a value below 20 signals a weak or ranging environment. When you see ADX rising above 25 while gold is making higher highs, you have a strong uptrend. When ADX drops below 20, trend‑following strategies lose their edge, and you may want to book profits or switch to range tactics.
Moving Averages as Dynamic Guideposts
Simple moving averages, such as the 50‑ and 200‑period lines, act as trailing support or resistance. In an uptrend, price tends to stay above the 50 MA and often bounces off it after pullbacks. A cluster of moving averages sloping in the same direction reinforces the trend's health. If the 50 MA crosses below the 200 MA (a death cross), the broader trend may be turning bearish.
Relative Strength Index (RSI) and Volume
RSI helps spot momentum divergences. When price makes a higher high but RSI puts in a lower high, the uptrend is losing steam. Volume adds conviction: rising volume during trend moves and declining volume during corrections confirm that institutional money is still behind the move. Combining these tools prevents you from entering a tired trend that is about to reverse.
For those who want to automate pattern recognition, tools like automated candlestick pattern detection can save hours of manual analysis and help you spot trend‑continuation or reversal signals faster. Always use such tools as a complement to your own chart reading, not as a replacement.
Trading With the Trend vs. Fading It: When to Do What
Trading with the trend is the highest‑probability approach for most retail investors. After you identify a higher‑high, higher‑low structure in gold, you wait for a pullback to a logical support zone—a previous resistance turned support, a rising trend line, or a moving average. Placing a buy order there with a stop below the last higher low keeps your risk small while letting you ride the trend.
Fading the trend—trading against the dominant direction—can be profitable but demands precision. You should only attempt it when you spot clear exhaustion signals: a triple divergence on RSI, a long‑wicked pin bar at a major resistance, or a breakout that immediately reverses. In a mature uptrend, a fade trade might be a short near a resistance zone, but you must treat it as a scalp, not a swing trade. Confine fade attempts to tight stop placements and partial profit targets.
During a sideways consolidation, every bounce near the range boundary is essentially a fade trade, and that is healthy. The range itself gives you permission to buy at support and sell at resistance. The danger zone is trying to fade a powerful trending day because you think gold “has moved too far.” Respect momentum and let gold trend analysis guide your bias.
Multi‑Timeframe Trend Alignment: The Complete Picture
One of the biggest mistakes retail investors make is trading off a single chart. Gold trend analysis becomes far more reliable when you align three timeframes: the higher timeframe for direction, the intermediate for structure, and the lower for entry. For example, if the weekly chart shows an uptrend (higher highs and higher lows), your daily chart should only look for buy setups.
On the daily chart, you might watch for a pullback to the 50‑day moving average within that weekly uptrend. Then drop to the 4‑hour chart to pinpoint a bullish engulfing candle or a break of a secondary trend line. That multi‑timeframe alignment ensures you are trading in the same direction as the biggest money flows, dramatically improving your win rate.
When the weekly, daily, and 4‑hour trends all agree, the trade has a higher probability of reaching its target. When they conflict, it is usually best to stand aside or reduce position size. Gold trend analysis is not about being in the market all the time; it is about being in the market only when the odds are stacked in your favour.
Key Takeaways
- Gold trend analysis identifies whether the market is in an uptrend (higher highs, higher lows), downtrend (lower highs, lower lows), or sideways consolidation.
- Draw trend lines by connecting at least two swing lows for uptrends or swing highs for downtrends, seeking multiple touches for confirmation.
- Use ADX, moving averages, RSI divergences, and volume changes to measure trend strength and avoid false signals.
- Trade with the dominant trend for higher probability; fade only at clear exhaustion points or within a well‑defined range.
- Align weekly, daily, and 4‑hour timeframes to trade in the direction of the larger market flow.
Conclusion
Gold trend analysis transforms a confusing price chart into a clear roadmap. When you can confidently read higher highs and lower lows, draw valid trend lines, and gauge strength with reliable indicators, you no longer react emotionally to spikes. You plan your trades around the market's structure.
Start by practising on historical charts. Mark the swing points, draw your lines, and note how price respected them. Then apply the system on a demo account. As you grow comfortable, you can bring that same discipline to a Shariah‑compliant platform like SmartGoldTrade, where you trade physical gold with no interest and no leverage. Let the trend be your compass, and trade only when the picture is clear.
FAQ
- How do I know if a trend line break is real or a fakeout?
- Wait for a candle close beyond the line and preferably a retest. Volume confirmation and a break of the most recent swing low (in an uptrend) add conviction. A quick wick through the line that quickly reverses is often a trap.
- Can I use gold trend analysis on very short timeframes like 5‑minute charts?
- Yes, but noise increases. Shorter timeframes require tighter stops and may give more false signals. Many traders prefer 1‑hour and higher for cleaner structures, saving the 5‑minute chart only for pinpoint entries.
- What should I do when the ADX is below 20?
- A low ADX signals a ranging market. Avoid trend‑following strategies and instead use range‑trading methods such as buying near support and selling near resistance until a breakout confirms a new trend.