
The gold price is defending a critical technical pivot at $4,788 in the run-up to the American session on Wednesday. The market is reacting to a fresh warning from a key Federal Reserve official who confirmed that persistent oil price shocks are feeding into core inflation. This immediate fundamental context reinforces gold's role as a traditional inflation hedge. We analyze whether this support will catalyze a fresh push towards $4,846 resistance or if a deeper pullback is brewing.
St. Louis Fed President Alberto Musalem's exclusive note this morning is the dominant macro theme, focusing traders' minds on the persistent inflation narrative. This has capped any significant selloff, yet the price action remains hesitant, trapped below the formidable $4,819 MA200 level. The upcoming New York session will be decisive in determining if bulls have the conviction to challenge overhead resistance or if bears will gain control for a deeper technical correction.
Gold Market Overview
Macro Context
The U.S. Dollar Index (DXY) remains firm but off its recent highs, providing a mixed backdrop for dollar-denominated gold. Treasury yields are stable, with the market still digesting last week's hotter-than-expected inflation data. The core driver for the past 24 hours is clearly the Fed commentary. President Musalem’s explicit statement that the Middle East-driven oil shock is feeding core inflation and his expectation for it to linger near 3% this year validates the 'higher-for-longer' rates narrative. Geopolitical tensions provide a persistent, if not currently escalating, bid for safe-haven assets like gold.
Session Outlook
The American session today carries typical NY liquidity, which often translates into clearer directional moves following the often-range-bound Asian and European hours. The key trigger is the market’s interpretation of the Fed’s inflation warning. Does it spur fresh safe-haven buying in gold, or does it bolster the dollar and yields, capping gold's upside? The expected daily volatility range, based on the ATR(14) of $14.49, suggests intraday swings between roughly $4,794 and $4,823. Watch for a sustained break above or below the $4,788 - $4,819 bracket for the next directional signal.
Technical Analysis
The current gold price is $4,808.78, placing it in a tense consolidation zone between key moving averages and horizontal support. The RSI(14) sits at 55.6, firmly in neutral territory, which indicates there is room for the trend to extend in either direction before becoming overbought or oversold. The immediate battle is between the short-term bullish momentum and the long-term bearish pressure from above.
Moving Average Structure
The moving average structure tells a story of conflicting timeframes. The price is above the MA20 at $4,794.86 and the MA50 at $4,756.71, confirming a short to medium-term bullish bias. However, it remains just below the formidable MA200 at $4,819.20. This places gold in a classic technical tug-of-war: bulls are in control on lower timeframes, but they have yet to conquer the primary long-term bear territory defined by the 200-period average.
RSI and Momentum
With an RSI reading of 55.6, momentum is neither strongly bullish nor bearish. This neutral reading suggests the market is in a state of equilibrium following recent moves. It provides no immediate contrarian signal but does indicate that a breakout from the current consolidation will likely be fueled by a fresh fundamental catalyst, such as the Fed news we are reacting to. A move above 60 would signal building bullish momentum, while a drop below 45 would suggest bears are taking control.
Key Price Levels
The framework for this session is defined by clear support and resistance from our live indicator data. Immediate support is at S1: $4,787.61, followed by stronger support at S2: $4,730.58. On the upside, the first hurdle for bulls is R1: $4,857.30, with R2: $4,845.67 acting as a nearer-term cap. The ATR(14) of $14.49 gives us a statistically derived expected range; a move beyond ±$14.50 from the session open would be considered high volatility.
| Timeframe | Upside Target | Downside Target |
|---|---|---|
| Daily (D1) | $5,250 | $5,014 |
| 4-Hour (H4) | $4,846 | $4,788 |
| 1-Hour (H1) | $4,851 | $4,788 |
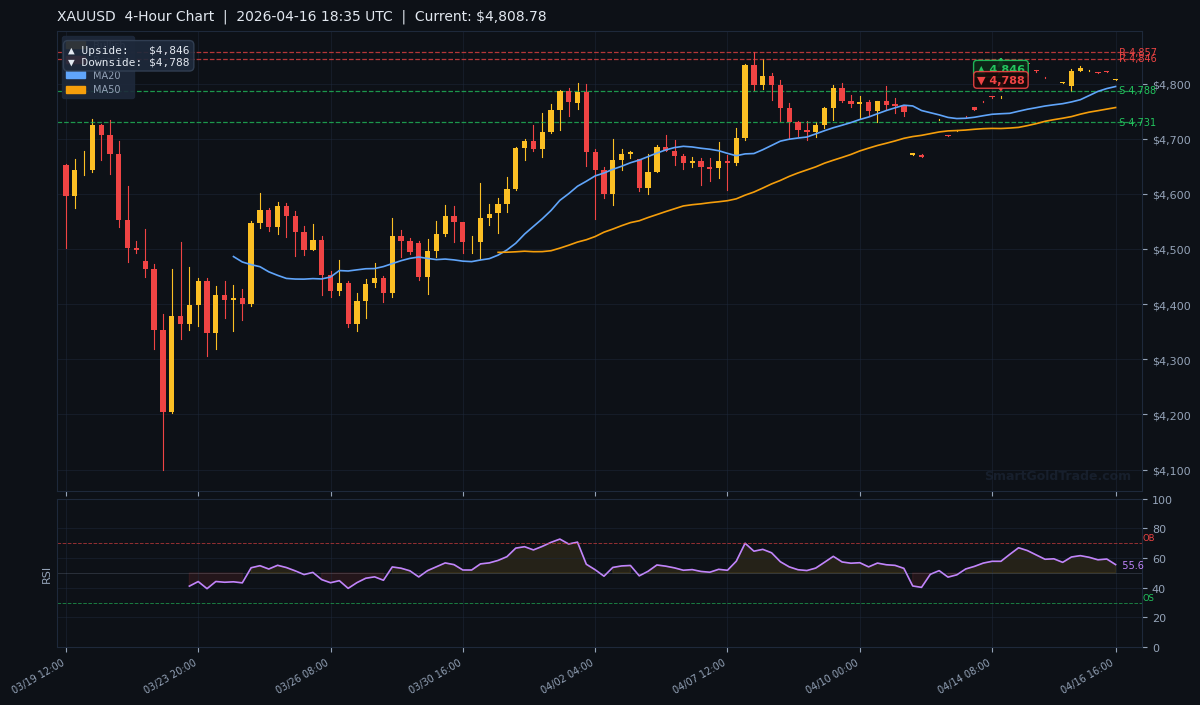
The 4-hour chart shows the consolidation clearly, with the price interacting with the cluster of moving averages. The pivot at $4,788 aligns perfectly with the S1 support level and the lower boundary of recent price action. A clean break below this zone on the H4 close would be a significant bearish development.
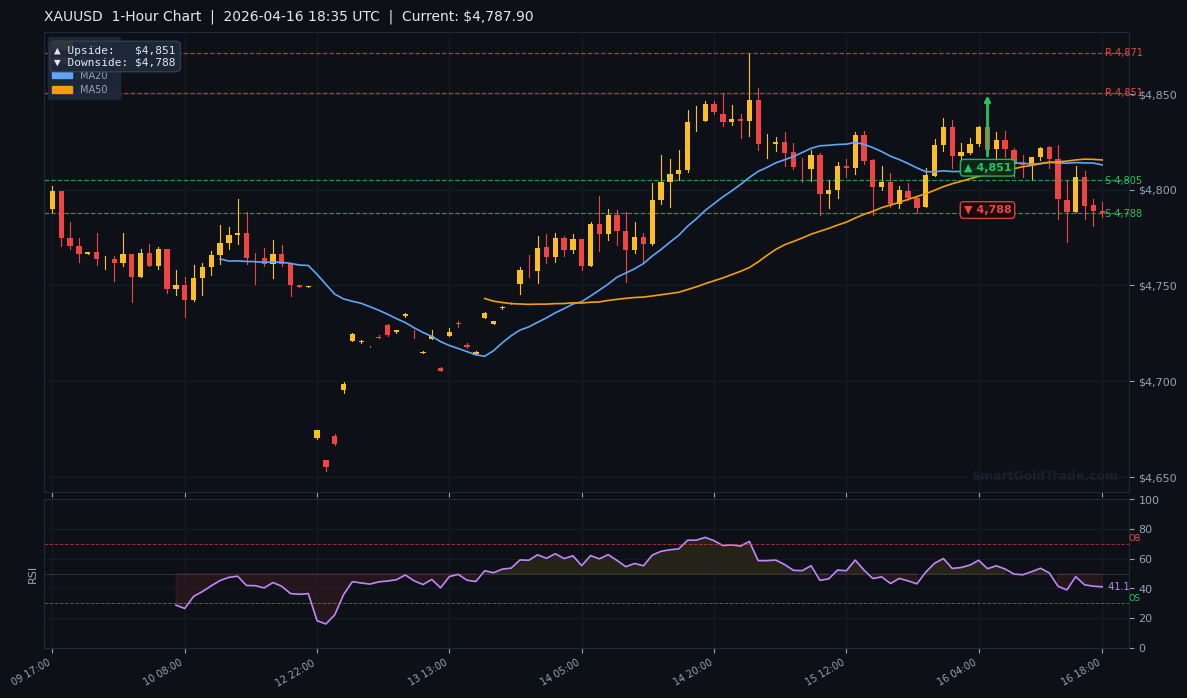
The 1-hour chart offers a more granular view of the intraday battle. It highlights the immediate $4,851 upside target and reaffirms the critical nature of the $4,788 support. The shorter moving averages are tightly coiled, indicating an imminent volatility expansion is likely.
Fundamental Drivers
The primary fundamental driver this morning is the Fed's explicit acknowledgment of inflation persistence. St. Louis Fed President Alberto Musalem stated that the oil shock from the Middle East conflict is feeding core inflation, which he expects to remain near 3% throughout the year. This is not new data, but it is a powerful official confirmation of the market's dominant fear. For gold, this is a double-edged sword: it reinforces its appeal as an inflation hedge but also bolsters the argument for a Fed that cannot afford to cut rates soon, which supports the dollar.
The immediate market reaction has been cautious. The comment has prevented a deeper selloff in gold, as traders price in prolonged real (inflation-adjusted) negative interest rates. However, it has also not sparked a furious rally, as the dollar retains a yield advantage. The correlation with the DXY remains inverse but muted for now, as both assets are drawing some safe-haven flow from the underlying geopolitical and economic uncertainty.
Key Event to Watch
The single most important event this week will be any further commentary from Fed officials, particularly those seen as centrists or doves. Markets will scrutinize every word for shifts in tone regarding the timing of potential rate cuts. A chorus of voices echoing Musalem's inflation concern could solidify a near-term ceiling for gold below the $4,850 region. Conversely, any official downplaying of the oil impact or emphasis on weakening labor data could be the catalyst for a breakout above $4,819.
Devil's Advocate
The prevailing short-term bias is cautiously bullish, supported by the MA structure and the defense of $4,788. However, this outlook is fragile. What would invalidate it? A clear, hourly close below the $4,787.61 support level would be the first major warning sign. This breach would likely trigger stops and open a path down toward the next significant technical zone around $4,730.58 (S2).
The fundamental flip scenario would be a sudden de-escalation in Middle East tensions, leading to a sharp drop in oil prices. This would undercut the 'inflation persistence' narrative that is currently supporting gold. Combined with a surprisingly strong batch of U.S. retail sales or jobless claims data later in the week, this could swiftly reverse sentiment, forcing gold bulls to capitulate and targeting a move back toward the $4,756 MA50.
Trading Strategy for American Session
Given the tense consolidation at a key pivot, the optimal strategy is to wait for a confirmed breakout with a defined risk-reward setup. The battle zone is between $4,788 (support) and $4,819 (MA200 resistance). A conservative approach is to stand aside until one of these levels breaks on a closing basis on the H1 or H4 chart.
Bullish Scenario (Break & Retest): A sustained move above $4,819 with a subsequent retest that holds as support could offer a long entry. Initial target would be R2 at $4,845.67, with an extension to $4,851. A stop loss could be placed below the breakout point, using 1.5x the ATR (approx. $21.50) for safety, e.g., near $4,797.
Bearish Scenario (Support Failure): A decisive hourly close below $4,787.61 opens a short opportunity. The initial target would be a test of the $4,756 MA50 region, with S2 at $4,730.58 as a secondary target. A stop loss should be placed above the broken support and the session high, around $4,815. For traders seeking guidance on precise entry and exit levels, services that provide professional gold trading signals can offer real-time alerts based on such technical triggers.
Key Takeaways
- The gold price at $4,808.78 is in a tense standoff, trading above short-term MAs but below the critical long-term MA200 at $4,819.20.
- Immediate support is clustered at $4,787.61 (S1), which aligns with the H4 downside target of $4,788.
- Fed President Musalem's confirmed inflation warnings this morning provide a fundamental floor but have not yet sparked a decisive rally.
- A break above $4,819.20 targets $4,845.67 (R2) and $4,851, while a break below $4,787.61 targets the $4,756 MA50 support.
- The RSI at 55.6 is neutral, indicating the market awaits a fresh catalyst for its next directional move.
- Expected daily volatility, per the ATR(14), is approximately $14.49.
Conclusion
The stage is set for a volatile American session as the gold price defends a pivotal technical level. The convergence of the $4,788 horizontal support with the short-term moving averages creates a high-probability reaction zone. The fundamental backdrop, underscored by the Fed's inflation vigilance, offers enough uncertainty to fuel sharp moves in either direction. The bias remains cautiously bullish above $4,788, but the resistance at the 200-period average ($4,819) is the clear line in the sand. Traders should prepare for increased volatility; a confirmed breakout from this $30 range will dictate the trend for the coming days, potentially offering a strategic entry for those looking to Islamic partnership investment in gold's long-term trajectory.
Frequently Asked Questions
- What is the most important gold price level to watch right now?
- The most critical level is $4,787.61. A sustained break below this support, confirmed by an H1 or H4 close, would signal a shift in short-term control to the bears, targeting $4,756 next.
- Is gold in a bullish or bearish trend?
- It depends on the timeframe. On the short-term (H4), the trend is bullish as price is above the MA20 and MA50. On the long-term (Daily), the trend is still bearish as price remains below the MA200 at $4,819.20.
- How will Fed news impact gold today?
- Today's Fed commentary on persistent inflation acts as a support. It prevents deep selloffs by reminding traders of gold's hedging utility, but it also caps rallies by supporting the dollar. The net effect so far is consolidation.
- What is a realistic profit target if gold breaks higher?
- The first major target on a clean break above $4,819 is the R2 resistance at $4,845.67. Beyond that, the H1 chart points to $4,851, and the daily chart suggests a much larger move toward $5,014 is possible in the broader context.
Risk Disclaimer: Trading Gold (XAU/USD) carries significant risk of loss and is not suitable for all investors. This content is for informational purposes only and does not constitute financial advice. Always conduct your own research and trade responsibly.