
Gold price begins the June 1, 2026 Asian session coiled near $4,538.90, a level that demands patience, not impulse. Last week’s China NBS Manufacturing PMI for May printed exactly at the 50 forecast, reflecting stagnation in factory activity and doing little to energize bullion. With the weekend headlines quiet and no high-impact data on the immediate calendar, the tape is drifting on fumes.
Thin liquidity is the dominant feature this morning — the kind of environment where disorderly wicks appear and vanish in minutes. Traders who chase breakouts in these conditions often pay a premium. Instead, the session should be treated as a preparation window: watch the levels, respect the structure, and wait for the market to show its hand before committing capital.
Gold Price Market Overview and Asian Session Outlook
Macro Context
The broader macro picture keeps gold price in a holding pattern. The US Dollar Index has been firm but not explosive, while 10-year Treasury yields continue to hover in a range that offers no decisive cue for XAU/USD. Federal Reserve rhetoric leans data-dependent, with markets pricing a shallow rate path for the remainder of 2026.
Geopolitical risk is present but not acute; the absence of fresh escalation keeps safe-haven demand on a leash. In this environment, gold lacks a clear directional catalyst, which explains the choppy sideways price action seen across the last several sessions.
Session Outlook
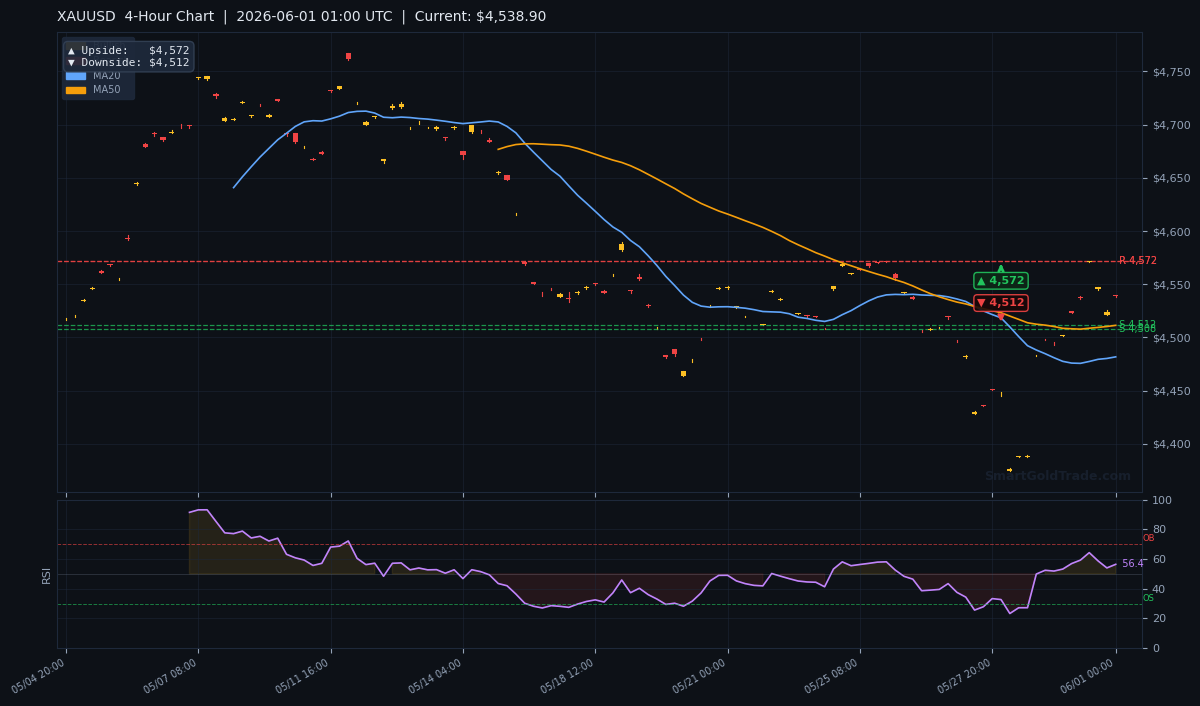
Asian hours are notorious for low volume, and today will be no exception. Liquidity will be paper-thin until Tokyo begins to wake up fully, and even then, the absence of tier-one data means price movement will be technically driven. Expect a drift between $4,511 and $4,540, with any break likely to extend toward the 4-hour pivot arrows drawn at $4,512 on the downside and $4,572 on the upside.
False breaks are common in these conditions, so confirmation — a 15-minute close beyond the level — is essential before acting. The session is best used for marking levels, not committing size.
Gold Price Technical Analysis
Moving Average Structure
The moving average ribbon reveals a mixed signal that requires careful reading. Price currently sits at $4,538.90, above the 20-period MA at $4,481.69 and the 50-period MA at $4,511.30, which is a short- and mid-term bullish condition. However, the 200-period MA looms at $4,630.30, well above current price and confirming bear territory on the longer time frame.
More importantly, the EMA structure shows the MA20 below the MA50 — a configuration that flags short-term bearish pressure despite price holding above both averages. This divergence often resolves with a downside probe before any sustained rally.
RSI and Momentum
The 14-period RSI reads 56.4, squarely in neutral territory. There is no overbought or oversold extreme to fade, which means momentum traders have no statistical edge right now. The reading suggests that directional energy is not yet committed; it could tip either way. A move above the 60 level would attract momentum buyers, while a dip below 50 would shift the bias toward sellers. For the Asian session, RSI neutrality supports the range-trading thesis.
Key Price Levels
Support and resistance levels derived from the live indicator set define the battlefield. Immediate support is S1 at $4,511.81, with secondary support S2 at $4,507.87. On the upside, resistance stands at R1 $4,589.39 and R2 $4,571.76.
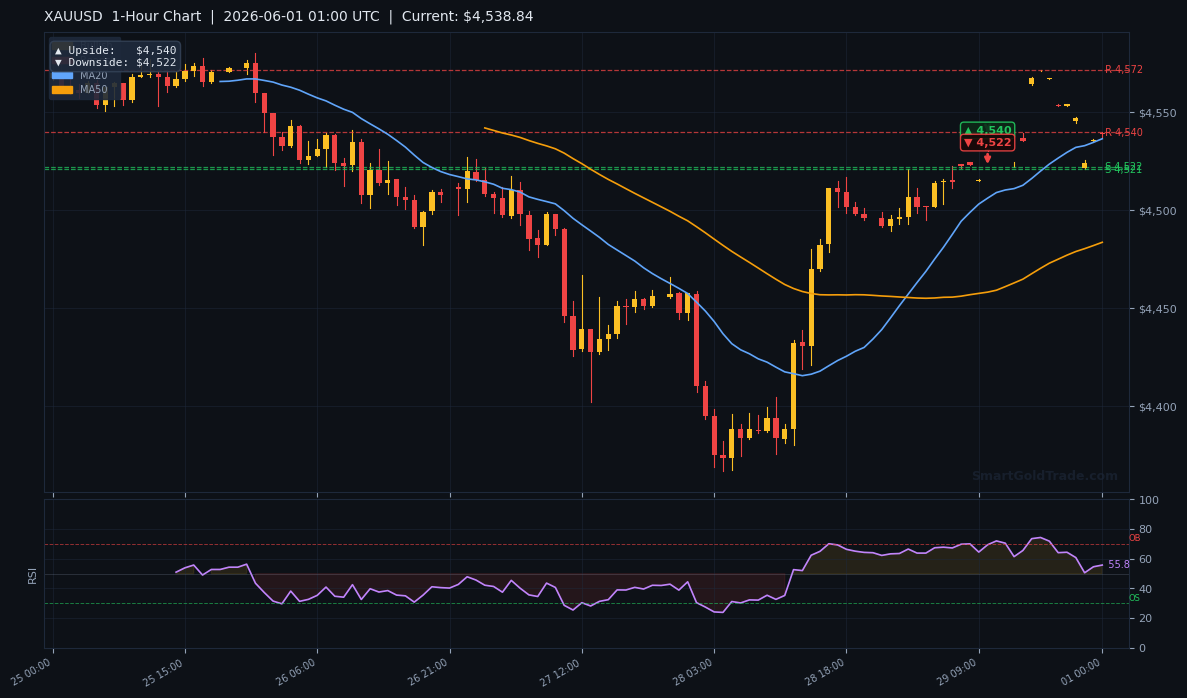
The Average True Range (ATR) of $25.56 suggests a reasonable daily range of approximately $25 — enough for a tradable move, but not so wild that stops need to be excessively wide. The 1-hour chart lays out upside targets at $4,540 and downside targets at $4,522, while the 4-hour expands that to $4,572 and $4,512 respectively. The daily arrows point to $4,838 on the upside and $4,667 on the downside.
| Timeframe | Support / Downside | Resistance / Upside |
|---|---|---|
| 1-Hour | $4,522 | $4,540 |
| 4-Hour | $4,512 | $4,572 |
| Daily | $4,667 | $4,838 |
Fundamental Drivers for Gold Price
Overnight, the only notable data point was China’s NBS Manufacturing PMI for May, which met the consensus at 50. A reading right at the expansion-contraction boundary underscores the sluggish recovery in the world’s second-largest economy, keeping a mild headwind on industrial commodity demand but not directly moving gold price. The US Dollar Index has edged slightly lower, offering a small tailwind, but without a sharp break in the DXY, gold will struggle to escape its range.
The Federal Reserve remains in a wait-and-see posture; markets are not expecting a near-term policy shift, and that predictability keeps gold from experiencing fear-driven spikes.
Key Event to Watch
This week, traders will shift their focus to the US ISM Manufacturing PMI release on Tuesday. A print below 50 — indicating contraction — would likely drive Treasury yields lower and give gold price the excuse to challenge $4,572 resistance. Conversely, a beat above expectations could reinforce dollar strength and test the $4,511 support zone with real volume. Until that catalyst arrives, range-trading discipline must be maintained.
Devil's Advocate: What Could Flip the Trade
The main risk to the range-bound thesis is a sudden liquidity grab that triggers stop-runs on both sides. A clean break above $4,589.39 (R1) on a 4-hour close could trap early shorts and ignite a rally toward the 200-day MA at $4,630.30. On the flip side, a decisive drop below $4,507.87 (S2) would invalidate the near-term bullish structure and open the door to the $4,489 region where previous support held.
In thin Asian trade, the probability of a false breakout is elevated, so the confirming close is everything. If volume fails to arrive behind the move, fading the breakout remains the higher-probability play.
Gold Price Trading Strategy for the Asian Session
With ATR at $25.56 and the market drifting, the most disciplined approach is to wait for a test of the $4,511 – $4,515 support zone. An entry near $4,513 with a stop loss set below S2 at $4,505 — just beyond the noise floor — offers a controlled risk profile. The first take-profit target sits at the 1-hour upside level of $4,540, which aligns with the session’s expected ceiling.
If momentum builds and the 4-hour resistance at $4,572 comes into play, scaling out a second position there would be prudent. Traders who prefer not to sit through the drift can use real-time trading alerts to stay informed of sudden shifts. Above all, do not chase a move that lacks volume confirmation; a quiet session punishes impatience.
Alternatively, for those seeking a hands-off approach while the market consolidates, copy trading professional gold traders can help sidestep the emotional traps of thin liquidity.
Gold Price Key Takeaways
- Gold price is hovering at $4,538.90, trapped between MA50 support ($4,511.30) and 1-hour resistance at $4,540.
- The EMA structure (MA20 below MA50) signals short-term bearish pressure, despite price sitting above both moving averages.
- RSI at 56.4 is neutral; momentum has yet to commit in either direction.
- Immediate support sits at $4,511.81 (S1), with the critical line in the sand at $4,507.87 (S2).
- A daily ATR of $25.56 suggests a contained session range, ideal for scalping defined zones.
- Tuesday’s US ISM Manufacturing PMI is the first major volatility catalyst of the week and could define the next $50+ leg.
Conclusion: Gold Price Outlook for June 1
The Asian session on June 1, 2026 presents a gold price environment that rewards preparation over action. The technical landscape is anchored by $4,511 support below and $4,540 resistance above, with the moving averages painting a cautiously bullish near-term bias that is not yet confirmed by momentum. Thin liquidity raises the risk of fakeouts, so waiting for a definitive close beyond a key level is the smartest play.
If the support holds and volume returns during European hours, a grind toward $4,572 becomes the base case. For now, keep position sizes light, respect the range, and let Tuesday’s US manufacturing data set the direction.
Frequently Asked Questions
- What is the most important support level for gold price today?
- The most immediate and critical support is $4,511.81 (S1), with secondary protection at $4,507.87. A break below S2 would open the door to $4,489.
- Is the gold price trend bullish or bearish right now?
- The short-term structure is mixed. Price is above the MA20 and MA50, but the MA20 remains below the MA50 — a bearish stack that urges caution. The RSI at 56.4 is neutral.
- What should traders watch for during the Asian session?
- Volume is extremely low. Traders should watch for a test of the $4,511–$4,515 zone and avoid entering on breakouts that lack a confirming 15-minute close beyond the pivot.
- Which upcoming event could move gold price the most this week?
- The US ISM Manufacturing PMI release on Tuesday is the standout event. A contraction print would likely support gold toward $4,572, while a beat could send it retesting $4,511.
- How wide should stop losses be in this environment?
- Given an ATR of $25.56, stops placed 8–10 points beyond the key support (e.g., $4,505 for an entry near $4,513) provide a reasonable buffer against noise without excessive risk.
Risk Disclaimer: Trading Gold (XAU/USD) carries significant risk of loss and is not suitable for all investors. This content is for informational purposes only and does not constitute financial advice. Always conduct your own research and trade responsibly.