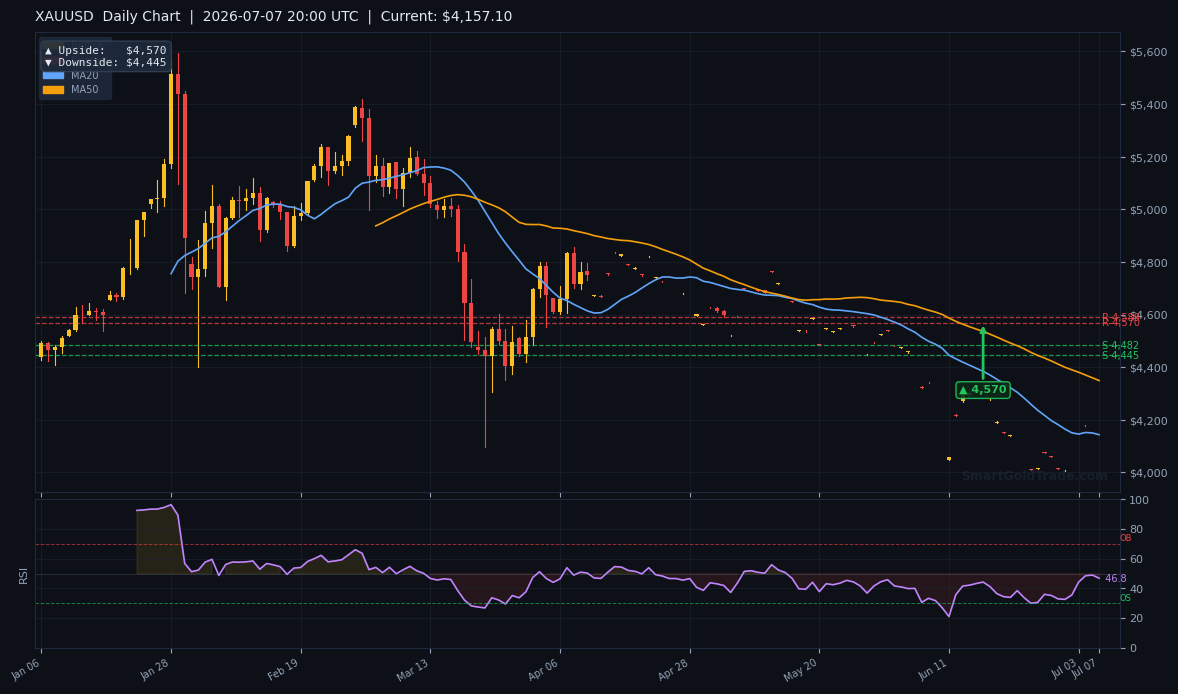
The gold price is hovering at $4,110.98 early in the American session, attempting to regain traction after a brief dip below the intraday chart’s $4,138 level. Traders are watching the reaction to last month’s surprising trade data out of Indonesia, which showed its first deficit since the pandemic. While the broader macro picture remains mixed, the technicals are carving out a clear risk-defined opportunity from the $4,148 support zone. This session could deliver the breakout or bounce that swing traders have been waiting for.
Gold Market Overview
Macro Context
The U.S. Dollar Index (DXY) is oscillating near 105.2, and the 10-year Treasury yield sits just above 4.80%, keeping a lid on aggressive gold bids. However, markets have priced in a final Fed rate hike for the September meeting, and any dovish shift in rhetoric could weaken the greenback quickly. Geopolitical jitters — particularly around energy supply routes — continue to offer a steady undercurrent of safe-haven demand. Meanwhile, real yields remain elevated, yet central bank gold buying — especially from China and Poland — has provided a structural floor under the gold price in recent quarters.
Overnight, Société Générale highlighted Indonesia’s May 2026 trade figures, which registered the country’s first deficit since the pandemic and a record oil and gas shortfall. Emerging market stress of this magnitude often channels capital toward gold as a non-sovereign store of value, especially in Asian trading hours. That undercurrent could underpin bids well into the New York session.
Session Outlook
The American session typically brings a surge in liquidity after the European close, often amplifying technical breakouts. With the gold price trading just below the 4-hour chart’s $4,138 mark, the bias leans cautiously bearish intraday. Yet the RSI is neutral and the EMA structure on the H4 timeframe remains positive, suggesting sellers haven’t taken full control. I expect price to oscillate between $4,130 and $4,182, with the $4,148 support acting as the make-or-break pivot for the rest of the week. Volume profiles show a high-volume node near $4,160, which may act as a magnet if buyers step in; a break above that level would shift intraday momentum firmly in the bulls’ favor.
Gold Price Technical Analysis
Moving Average Structure
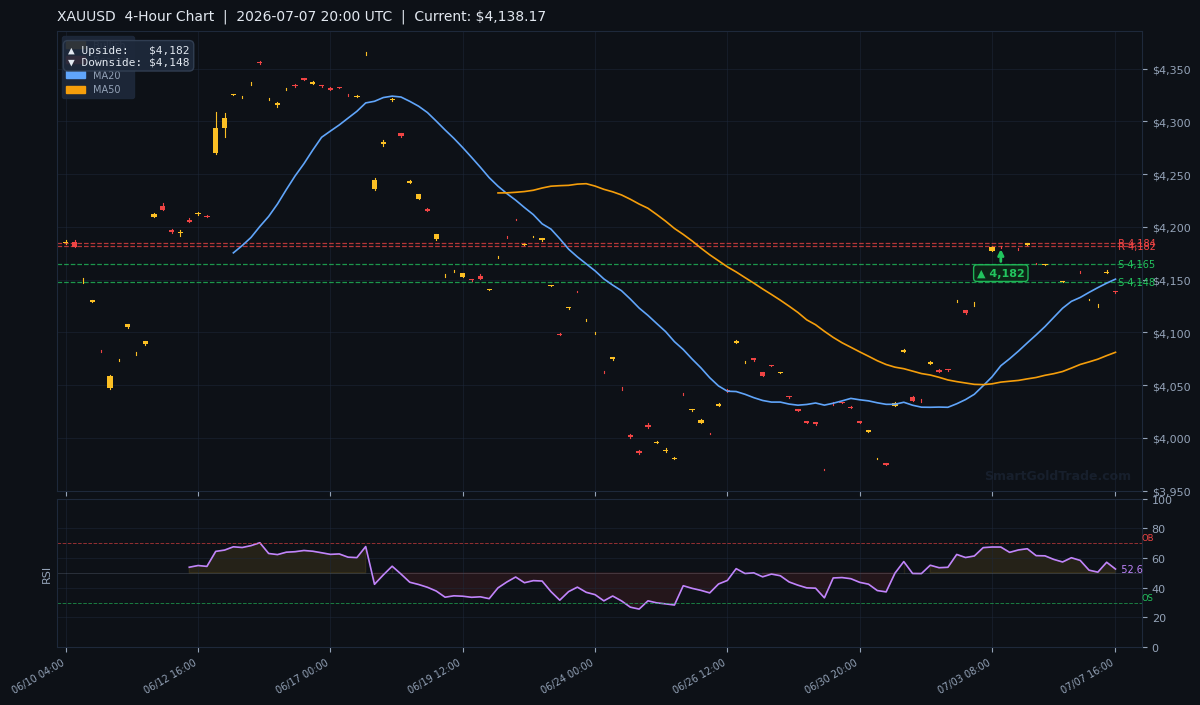
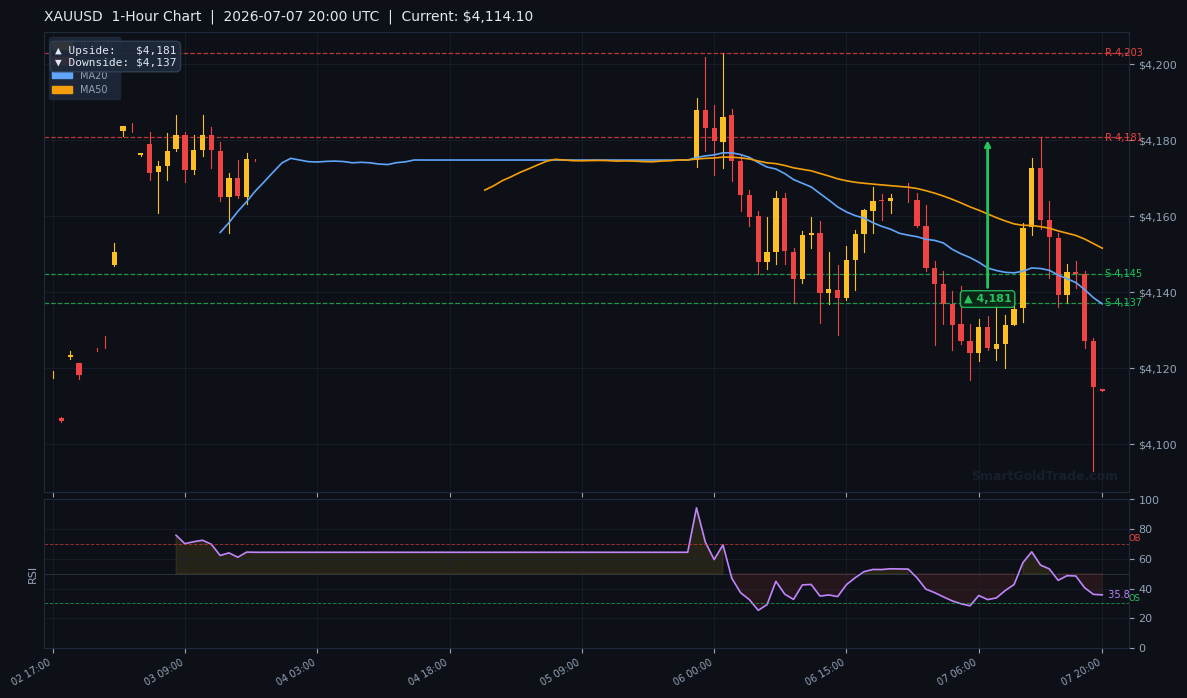
The 4-hour chart shows the gold price at $4,138.17, sitting below the 20-period moving average at $4,150.47 — a short-term bearish signal. However, price remains comfortably above the 50-period MA at $4,081.16, keeping the mid-term trend bullish. The 200-period MA looms above at $4,271.34, confirming that the pair is still in bear territory on a longer horizon. Critically, the EMA structure reads MA20 > MA50, which indicates short-term bullish momentum — a divergence that often precedes a squeeze higher. The alignment also suggests a ‘bull flag’ formation on the H1 chart; if triggered by a break above $4,160, it could target $4,200 in quick succession.
RSI and Momentum
The 14-period RSI is at 52.6, squarely in neutral range. There is no overbought or oversold signal, giving neither side a clear advantage. This reading points to consolidation, where a decisive break above $4,184 or below $4,148 would confirm the next directional leg. Momentum oscillators on the 1-hour chart are flattening, suggesting a pending volatility expansion.
Key Price Levels
Support levels stack at S1: $4,164.51 and S2: $4,147.61. Resistance is clustered at R1: $4,184.32 and R2: $4,181.55. With the current price below S2, the bulls need to reclaim $4,148 quickly to avoid a deeper slide. The average true range (ATR) of $13.30 projects an expected daily range of roughly $4,125 to $4,151, which aligns with the $4,130 stop-loss zone identified below.
| Timeframe | Upside Target | Downside Target |
|---|---|---|
| Daily | $4,570 | $4,445 |
| 4-Hour | $4,182 | $4,148 |
| 1-Hour | $4,181 | $4,137 |
Fundamental Drivers
Beyond the charts, gold is digesting the fallout from Indonesia’s May trade data, which Société Générale flagged as the first deficit since the pandemic. A record oil and gas shortfall in a G20 economy often translates into higher import costs and weaker domestic currency, stoking inflation fears across the ASEAN region. Historically, such episodes push local investors toward physical gold and international spot markets alike. Beyond Southeast Asia, Indian gold imports have ticked higher ahead of the festival season, adding extra physical demand that often underpins the spot gold price during the summer months.
The Fed’s hawkish pause keeps a ceiling on gold, but the DXY is struggling to push above 106.00 decisively. Any softness in this week’s U.S. import price data — due Wednesday — could open the door for a dollar retreat, lifting gold. Geopolitically, simmering tensions in the Middle East continue to provide a bid floor below $4,080. For those looking to hold the metal physically as a hedge, it’s worth exploring purchase physical gold options that offer direct ownership outside the banking system.
Key Event to Watch
This week’s U.S. Import Price Index release on Wednesday is the marquee event. A softer print would reinforce the disinflation narrative and could propel the gold price back above $4,184. Conversely, a hotter reading would likely send XAU/USD re-testing the $4,130 floor. Keep an eye on the Fed’s Beige Book release as well, due later this week, as it could hint at regional economic softness and steer the dollar. Position sizing ahead of that release is paramount.
Devil’s Advocate
The bullish setup from $4,148 fails if the gold price closes a 4-hour candle below $4,137. That would align with the 1-hour downside target and trigger a run toward the $4,081 area, where the 50-period MA sits. Furthermore, a sudden spike in Treasury yields above 4.90% could negate any safe-haven bid and push the dollar higher, unwinding gold longs aggressively. In that scenario, all bets are off for a bounce, and the next support doesn’t arrive until $4,045.
Trading Strategy for American Session
The tactical trade is a limit-order bounce from the $4,148 support zone. Enter long between $4,148 and $4,153, expecting this level to hold as it coincides with the 4-hour downside target. Place a stop loss below the 1-hour swing low at $4,130, respecting the ATR of $13.30 and allowing room for noise.
The first take-profit target is $4,182, the 4-hour upside pivot, offering a 1:2.2 risk-reward profile. A more aggressive target sits at $4,207 if the dollar weakens post macro data.
For those who prefer automated execution, professional gold trading signals can translate these levels into real-time alerts without emotion.
Traders adhering to Islamic principles can execute this same setup through halal gold trading accounts that ensure full physical ownership and zero interest charges. Avoiding riba is essential, and platforms like SmartGoldTrade offer spot gold with no rollover fees, keeping the trade Shariah-compliant. This approach allows you to focus purely on the gold price action without worrying about prohibited financing costs.
This strategy remains valid only above $4,148; a 4-hour close below invalidates the setup entirely.
Key Takeaways
- The gold price is at $4,110.98 spot, with the 4-hour chart testing the $4,138 zone.
- Critical support sits at $4,148; a hold there opens the door to $4,182.
- RSI at 52.6 signals neutrality — wait for a decisive break before committing size.
- ATR of $13.30 places the daily range between $4,125 and $4,151.
- U.S. Import Price Index on Wednesday is the key event that could accelerate a move to $4,207.
- A 4-hour candle close below $4,137 flips the bias bearish toward $4,081.
Conclusion
The gold price is navigating a tense equilibrium between a supportive EMA structure and a short-term breakdown below MA20. The $4,148 support is the linchpin for this American session — a successful defense sets up a swift run to $4,182 and possibly higher. A failure, however, exposes $4,130 and the 50-period MA at $4,081. With the RSI neutral and volatility set to expand, this is a textbook low-risk, high-reward pivot play. Trade the level, not the noise.
FAQ
Why is the gold price focusing on the $4,148 level today?
The 4-hour chart’s S2 support and the pivot arrow’s downside target both converge at $4,148. A bounce from this level would confirm buyer interest and could propel XAU/USD toward $4,182.
What is the risk-reward ratio on the $4,148 entry trade?
With an entry near $4,148, a stop at $4,130, and a target of $4,182, the trade offers a risk-reward of approximately 1:2.2. This accounts for the ATR-based noise and the next resistance cluster.
What economic events could move the gold price this week?
The U.S. Import Price Index on Wednesday is the headline risk event. A softer print could weaken the dollar and push gold toward $4,207, while a stronger reading might send price back below $4,130.
Risk Disclaimer: Trading Gold (XAU/USD) carries significant risk of loss and is not suitable for all investors. This content is for informational purposes only and does not constitute financial advice. Always conduct your own research and trade responsibly.