
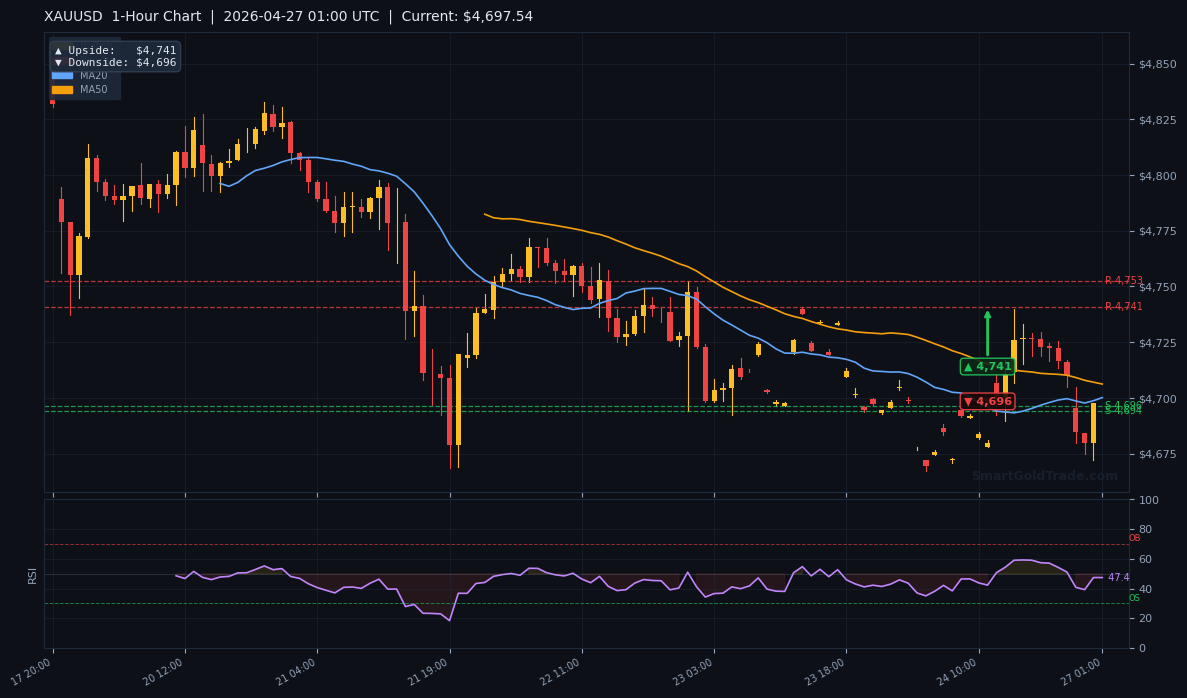
The gold price is trading at $4,697.34 this Asian session, hovering near a make-or-break level after a week of geopolitical jitters. With liquidity thinning and volatility compressing, today's setup offers a clean opportunity for patient traders. The 1-hour chart points to a potential bounce from $4,696 support toward $4,741 resistance, provided the $4,680 floor holds. Here is the complete gold price setup for April 27, 2026.
Gold Market Overview
Macro Context
The US Dollar Index (DXY) remains elevated near 104.80, pressuring gold despite rising geopolitical tensions. Last week's re-escalation in the Middle East – including the US Navy blockade update – initially pushed gold to a high of $4,745, but profit-taking erased gains. The Fed's hawkish hold on rates has capped the upside, with swap markets pricing a 65% chance of no cut in June.
Session Outlook
Asian liquidity is typically thin on Mondays, and today is no exception. Expect choppy price action with low participation. Range traders should watch for a break of $4,696 (1H downside pivot) or a rejection at $4,714 (intraday resistance). The gold price is likely to oscillate between $4,680 and $4,720, with a bias toward the upside if support holds. Avoid chasing breakouts – let the market prove itself.
Technical Analysis
Moving Average Structure
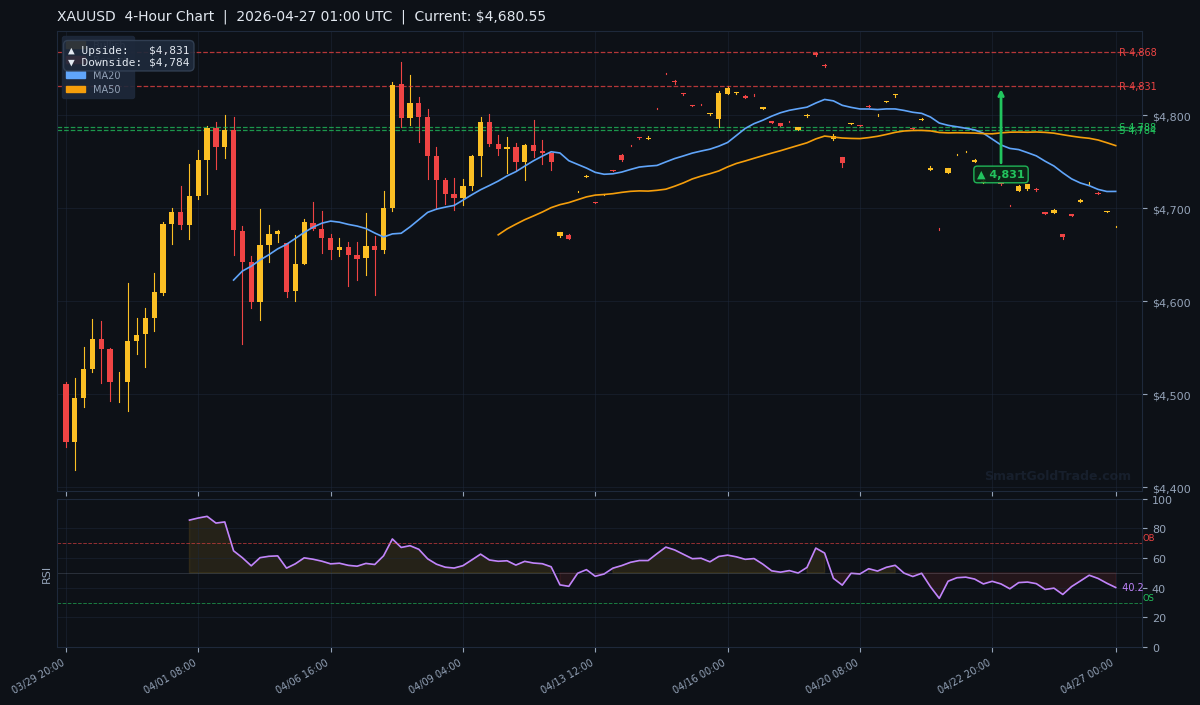
The H4 chart shows price well below all key moving averages: MA20 at $4,718.29, MA50 at $4,767.54, and MA200 at $4,737.27. The bearish crossover MA20 < MA50 confirms short-term downside pressure, but the deviation from MA20 is now extreme – often a precursor to a mean-reversion bounce. Traders should treat any rally as a pullback within a larger downtrend until price reclaims at least $4,718.
RSI and Momentum
RSI(14) sits at 40.2, squarely in neutral territory. This is far from oversold (below 30), giving room for additional downside – or a recovery rally. The lack of momentum divergence suggests the current bearish tilt remains intact, but the RSI is not confirming panic selling. A move above 45 would hint at early bullish rotation.
Key Price Levels
Support: S1 $4,787.61 (flips to resistance after breakdown), S2 $4,784.22. Resistance: R1 $4,868.16, R2 $4,845.67. The ATR(14) of $17.46 implies an average daily range of $17.46. Given the current price at $4,697.34, the ATR-based expected zone is $4,680 to $4,715.
| Timeframe | Upside Target | Downside Target |
|---|---|---|
| Daily | $5,238 | $4,996 |
| 4-Hour | $4,831 | $4,784 |
| 1-Hour | $4,741 | $4,696 |
Fundamental Drivers
Geopolitical tensions remain the primary catalyst. Last week's re-escalation – including new naval movements in the Gulf – pushed gold to $4,745 before buyers stepped away. The halal gold trading community noted the spike was short-lived, driven by fear rather than conviction. Meanwhile, US Treasury yields stayed near 4.70%, reinforcing the opportunity cost of holding non-yielding gold.
Key Event to Watch
This week's Fed speeches and the first reading of Q1 GDP (Wednesday) will dictate gold's next leg. If GDP disappoints, the gold price could rally toward $4,831 (4H upside target). If economic data remains resilient, a retest of $4,680 is likely.
Devil's Advocate
What could invalidate the bullish setup? A clear break below the $4,680 level (current H4 low) would turn the 1-hour pattern into a bear flag, targeting $4,624 (extension of ATR). In that scenario, the $4,678 level (previous session low) must hold. If it fails, the bias flips bearish, and longs should be avoided until price reclaims $4,697.
Trading Strategy for Asian Session
Entry zone: $4,695 – $4,700 (short-term support confluence with 1H pivot). Stop loss: $4,678 (below the $4,680 swing low; 1.5x ATR). Take profit 1: $4,741 (1H upside target). Take profit 2: $4,784 (4H downside pivot – becomes resistance). Risk-to-reward ratio is 1:2.3. Keep position size small – 0.5% of account risk – due to thin Asian liquidity. Do not add to losing positions.
Key Takeaways
- Gold price at $4,697.34 – testing 1-hour downside pivot of $4,696.
- RSI at 40.2 – neutral with room for a bounce toward 45.
- Price below all major MAs – bearish structure but oversold deviation suggests mean reversion.
- ATR of $17.46 – expected daily range: $4,680 – $4,715.
- Primary bullish target: $4,741 (1H upside pivot).
- Invalidation level: $4,680 – a daily close below opens path to $4,624.
Conclusion
The gold price setup for Asian session is a low-risk long entry with a tight stop. The confluence of the 1-hour support zone at $4,696 and the extreme deviation below MA20 increases the probability of a corrective bounce toward $4,741. However, patience is key – wait for a rejection candle near $4,695 before pulling the trigger. For those seeking a Shariah-compliant exposure, explore mudarabah investment plans that align with Islamic principles. Stay cautious, size appropriately, and let the market come to you.
Frequently Asked Questions
- Is the gold price going up today?
- Short-term bias is slightly bullish for Asian session, targeting $4,741. The setup relies on $4,680 support holding. If breached, trend flips bearish.
- What is the key gold resistance level today?
- The most immediate resistance is $4,741 (1H target), followed by $4,784 (4H pivot). A break above $4,741 opens the door to $4,831.
- Should I buy gold now at $4,697?
- Only with a stop-loss below $4,678 and a clear entry confirmation near $4,695. Do not chase the price above $4,710 – wait for retracement.
- How does the US dollar affect gold price this week?
- A strong DXY (104.80+) caps gold gains. If Q1 GDP data on Wednesday disappoints and the dollar weakens, gold could rally toward $4,831.
Trading Gold (XAU/USD) carries significant risk of loss and is not suitable for all investors. This content is for informational purposes only and does not constitute financial advice. Always conduct your own research and trade responsibly.