
The gold price is testing a critical support zone at $4,696 as European session liquidity picks up, following last week's rebound driven by a weaker US dollar and easing geopolitical tensions. Currently trading at $4,669.48, the metal sits below all key moving averages, amplifying bearish momentum. The next few hours could determine whether this support holds or gives way to a deeper sell-off.
Gold Market Overview
Macro Context
The US Dollar Index (DXY) softened after last week's disappointing economic data, providing a brief tailwind for gold. However, US Treasury yields remain elevated near 4.8%, weighing on non-yielding assets. The Federal Reserve's hawkish stance continues to cap upside, with markets pricing in a potential rate hold at the May meeting. Geopolitical tensions, while easing, still support occasional safe-haven flows.
Session Outlook
European session volatility is expected to expand as London opens. With no major economic releases scheduled for today, the gold price will likely follow technical levels and broader risk sentiment. The ATR(14) of $18.71 suggests a daily range of roughly $39, placing potential moves between $4,651 and $4,688 if the current trend persists.
Technical Analysis
Moving Average Structure
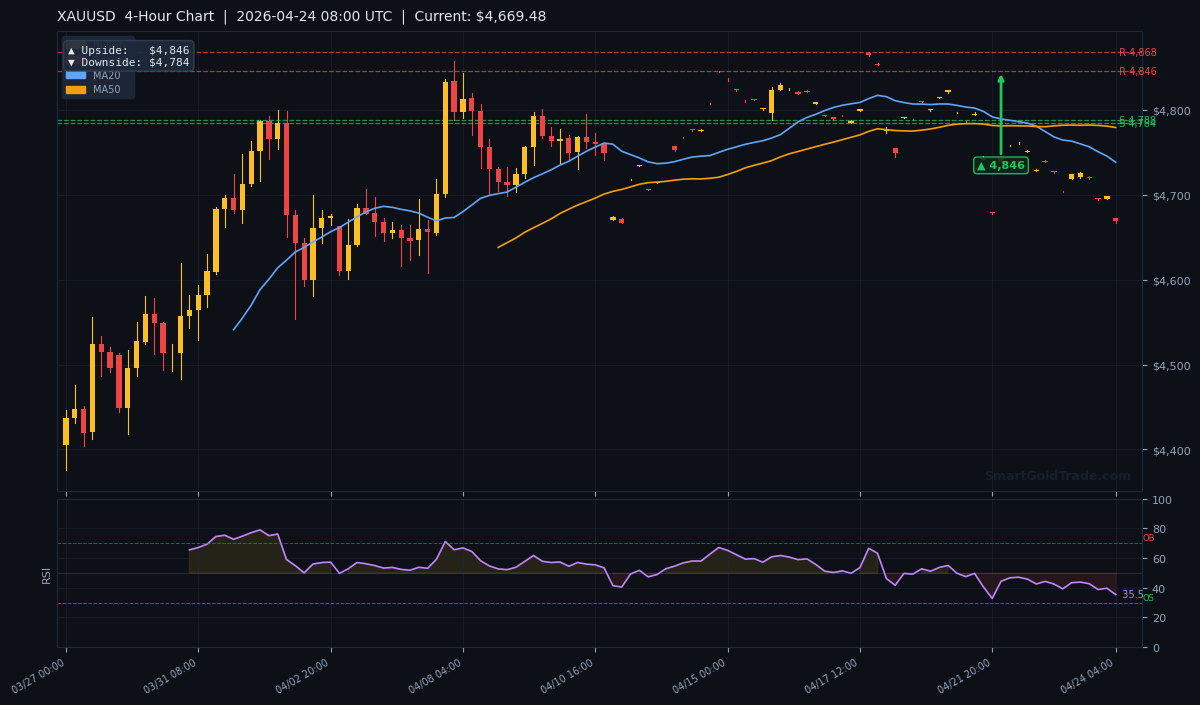
The MA20 at $4,738.32 is the first short-term resistance, while the MA50 at $4,779.25 and MA200 at $4,751.85 confirm a bearish alignment. Price below all three moving averages indicates a strong downtrend. The EMA structure (MA20 < MA50) further reinforces short-term bearish pressure.
RSI and Momentum
The RSI(14) stands at 35.5, which is neutral but close to oversold territory. A drop below 30 would signal an extreme condition, potentially leading to a bounce. However, the neutral reading suggests that bearish momentum can still accelerate without immediate exhaustion.
Key Price Levels
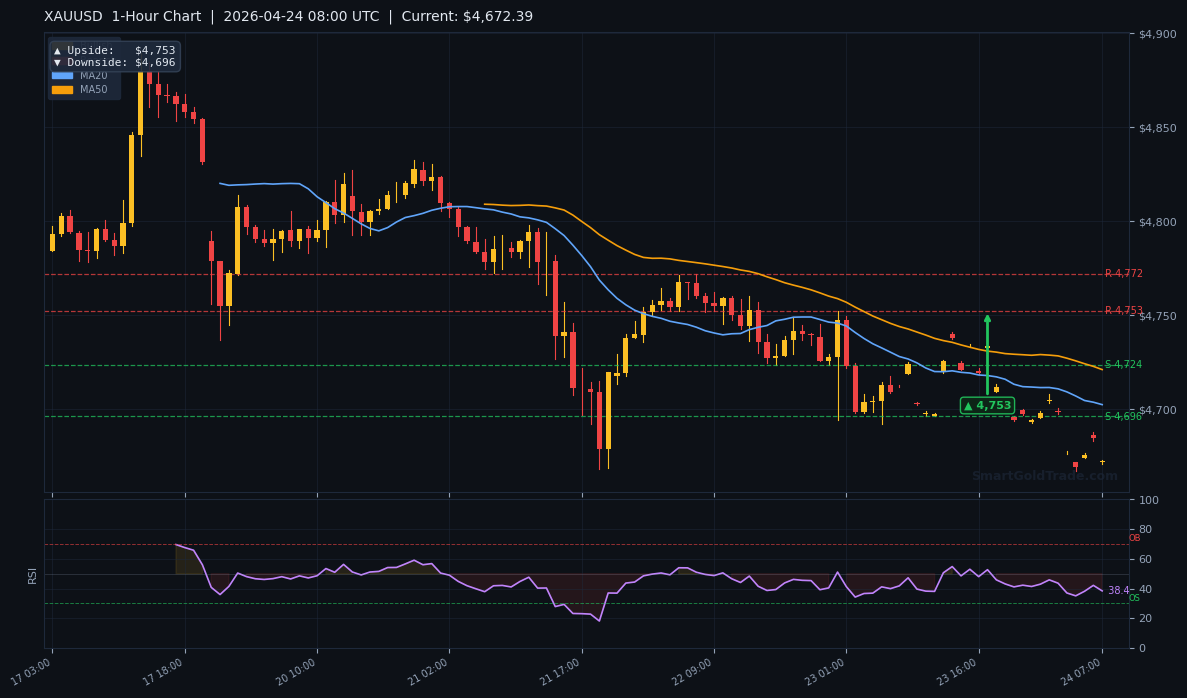
Support levels from the H4 chart: S1 at $4,787.61 and S2 at $4,784.22 — these are now above current price and serving as resistance. Resistance levels R1 $4,868.16 and R2 $4,845.67 are distant. The immediate focus is on the 1-hour downside target at $4,696 and the 4-hour downside target at $4,784. A break below $4,696 opens the door to $4,626 (extrapolated from ATR).
Fundamental Drivers
ING analysts Warren Patterson and Ewa Manthey reported that gold and silver rebounded after recent losses, supported by a weaker dollar and easing geopolitical tensions. That bounce has now faded, with the gold price returning to test fresh lows. The lack of follow-through buying suggests institutional distribution at higher levels.
Key Event to Watch
Later this week, US Q1 GDP data could inject volatility into the dollar and bond markets. A stronger-than-expected print would likely push yields higher and weigh on gold price, accelerating the current bearish bias. Conversely, a miss could trigger a relief rally toward $4,753.
Devil's Advocate
What if the $4,696 support holds? A strong intraday bounce above $4,710 would indicate buying pressure at the level, potentially driving price back to $4,753 (1H resistance). If bulls reclaim $4,784 (4H resistance), the bearish structure would be invalidated, and a move toward $4,846 becomes possible. Traders must watch for a decisive close above $4,720 to consider flipping long.
Trading Strategy for European Session
Bearish Scenario (preferred): Wait for a clear breakdown below $4,696 with a 1-hour candle close. Enter short at $4,690, stop loss at $4,714 (above recent swing high), and target $4,626 (1.5x ATR move). Risk-reward ratio is approximately 1:2.3.
Bullish Scenario (contrarian): If $4,696 holds and price breaks above $4,700 with strong volume, enter long at $4,705, stop loss at $4,685 (below support), and target $4,753 (1H resistance). Use a trailing stop once $4,730 is reached.
Given the neutral RSI and bearish moving average structure, the downside bias is stronger. For real-time entry signals, consider professional gold trading signals that include precise stop levels.
Key Takeaways
- The gold price at $4,669.48 is below all major moving averages, confirming a bearish trend.
- Immediate support is at $4,696 (1H downside target); a break opens $4,626.
- Resistance sits at $4,753 (1H) and $4,784 (4H pivot).
- RSI at 35.5 is neutral but could drop into oversold below 30.
- ATR of $18.71 suggests a daily range of ~$39.
- Focus on US Q1 GDP data later this week for further direction.
Conclusion
The gold price is at a make-or-break moment below $4,696. Bears have full control with price under all key moving averages, but the neutral RSI leaves room for a counter-trend bounce. Traders should monitor the European session for a clear breakout or reversal pattern. A failure to hold $4,696 would accelerate selling pressure toward $4,626 and potentially lower in the coming sessions. If you are looking to hedge or accumulate exposure, consider purchase physical gold as a long-term store of value.
Frequently Asked Questions
- What is the gold price today?
- The current gold price is $4,669.48 per troy ounce as of European session on April 24, 2026.
- What is the key support for gold right now?
- Immediate support is the 1-hour downside target at $4,696. Below that, the next major support is $4,626.
- Will gold bounce from $4,696?
- Possible, but only if price reclaims $4,710 quickly. A bounce toward $4,753 is the maximum upside before bears resume.
- Why is gold falling despite a weaker dollar?
- The weaker dollar provided only a temporary boost. Technical pressure from falling below all moving averages and elevated bond yields continue to dominate price action.
- What is the best trading strategy for today?
- Sell on a breakdown below $4,696 with a stop above $4,714 and target $4,626. Alternatively, buy on a confirmed hold of $4,696 with a tight stop.
Disclaimer: Trading Gold (XAU/USD) carries significant risk of loss and is not suitable for all investors. This content is for informational purposes only and does not constitute financial advice. Always conduct your own research and trade responsibly.