
Gold Price Momentum Fades — $4,724 Resistance Caps Recovery Attempts
The gold price has slipped to $4,719.36 in early American trading, extending its slide below multiple moving averages and confirming a bearish short-term structure. Last week’s Bank Indonesia decision to hold rates at 4.75% added to the global central bank caution narrative, but the XAUUSD selloff accelerated during Asian and European hours as dollar strength returned. Today’s NY session will determine whether the $4,724 level — the 1-hour downside pivot arrow target — flips from support into a new resistance cap that limits any bounce.
Gold Market Overview
Macro Context
The US Dollar Index (DXY) is trading near 101.80, recovering from recent lows and pressuring gold. US Treasury yields remain elevated with the 10-year at 4.32%, reducing the opportunity cost of holding non-yielding bullion. Fed expectations have shifted slightly hawkish this week after a string of resilient housing data, though no major US economic releases are due today. The market is pricing in a >70% chance of a 25‑basis‑point cut in June, but that hasn't provided enough tailwind for gold to break back above $4,756.
Session Outlook
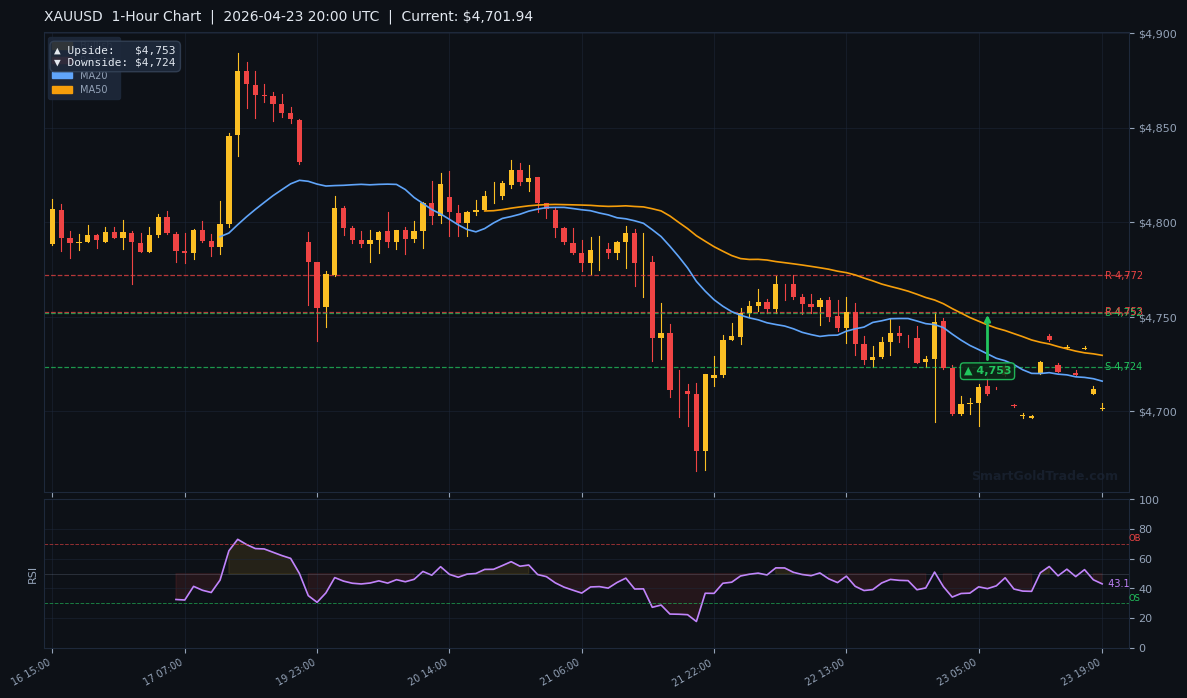
American session liquidity typically increases after 10:00 AM EST, which could trigger a breakout or breakdown from the current narrow range ($4,710–$4,730). With the gold price already below the 1‑hour downside target of $4,724, any intraday push above that level would signal a failed breakdown and attract short-covering. Conversely, a clean break below $4,710 opens a path toward the $4,700 psychological mark and possibly the next daily support zone near $4,660.
Technical Analysis
Moving Average Structure
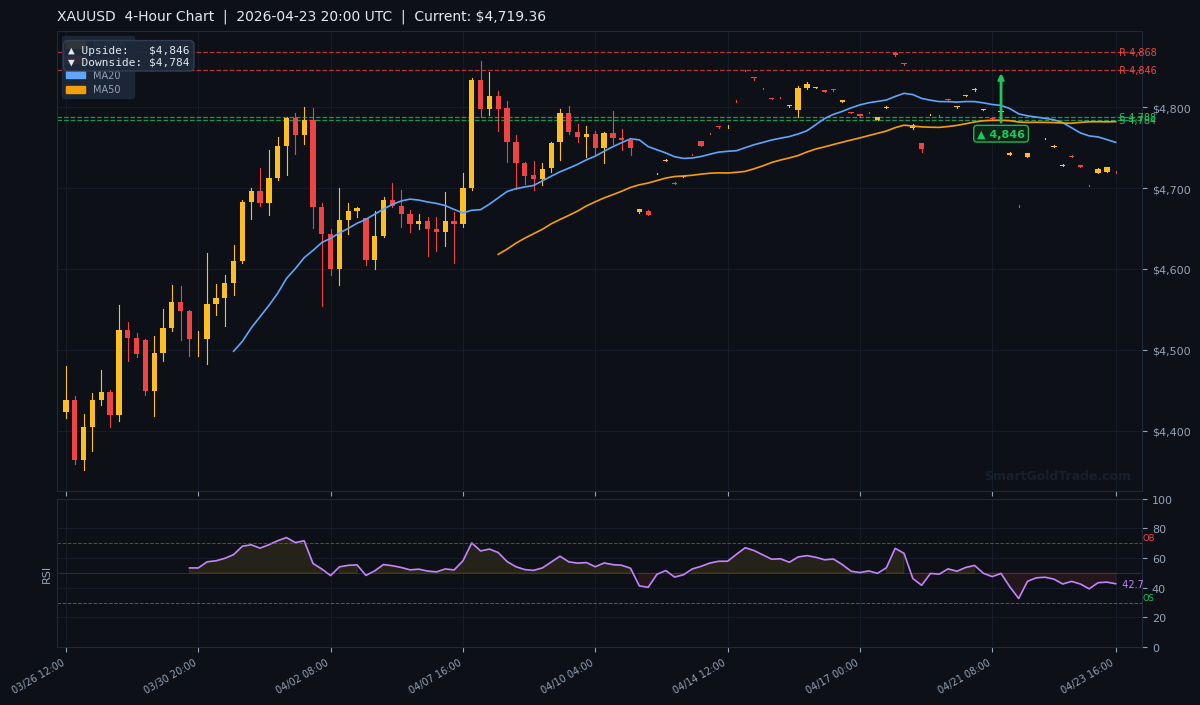
The MA20 (short-term) sits at $4,756.50, the MA50 (medium-term) at $4,782.18, and the MA200 (long-term) at $4,758.43. All three are stacked with MA20 < MA50 — a classic short-term bearish configuration. The gold price is trading $37 below the MA20, highlighting extreme downward pressure. Until the market reclaims the $4,756 level, every rally should be viewed as a selling opportunity.
RSI and Momentum
The RSI(14) reads 42.7, firmly in neutral territory but leaning bearish. There is no oversold signal yet, meaning further downside can materialise without a technical warning. The ATR(14) of $23.79 suggests a typical intraday range of about $24, so a move toward $4,700 or $4,744 is well within normal volatility expectations.
Key Price Levels
Support S1: $4,787.61 (now broken) | Support S2: $4,784.22 (broken). Resistance R1: $4,868.16 | Resistance R2: $4,845.67. These levels are from the daily structure and are far above the current price, indicating a steep bearish cliff. The price targets derived from the pivot arrows are more actionable: 1-hour upside $4,753 / downside $4,724; 4-hour upside $4,846 / downside $4,784; daily upside $5,238 / downside $4,996. The 1-hour downside target of $4,724 has already been breached during the European session, turning it into a resistance level for the rest of the day.
Fundamental Drivers
Bank Indonesia’s decision to keep its policy rate at 4.75% and retain the inflation target of 2.5% ±1% reaffirms the cautious stance of Asian central banks. While not a direct gold catalyst, the stability-first approach signals that emerging-market liquidity conditions remain tight, indirectly supporting the US dollar and weighing on gold price. Additionally, ongoing geopolitical tensions in the Middle East continue to provide a floor under gold, but the lack of escalation this week has allowed profit-taking to dominate.
Key Event to Watch
This week, traders should monitor Friday’s US Core PCE Price Index — the Fed’s preferred inflation gauge. A higher-than-expected reading would solidify the ‘higher for longer’ narrative, likely pushing gold below $4,700. Conversely, a miss could spark a relief rally back toward $4,756.
Devil's Advocate
The bearish thesis would be invalidated if the gold price breaks back above the MA20 at $4,756.50 and holds for a daily close. Such a move would shift the structure to neutral and potentially attract algorithmic buyers. Key reversal level: a clean reclaim of the 1-hour upside pivot target of $4,753 would trap late sellers and fuel a short squeeze toward $4,784.
Trading Strategy for American Session
Given the bearish momentum, the preferred setup is a sell on a retest of the $4,724 level (now resistance). Entry zone: $4,720–$4,726. Stop loss: $4,748 (above the 1-hour upside pivot). Take profit targets: first target $4,700 (round number), second target $4,680. If price gaps below $4,710 with volume, consider a breakout short targeting $4,680 directly. Alternatively, aggressive counter-trend buyers can look for a bounce from $4,700 with a stop at $4,690, targeting $4,724 and $4,753. Use the ATR of $23.79 to set appropriate risk distances — a 1% account risk on a $23 stop is a comfortable position size.
Key Takeaways
- Gold price current at $4,719.36 — below all major moving averages (bearish).
- 1-hour downside pivot target $4,724 broken — now acts as resistance.
- RSI at 42.7 (neutral) with room to fall before becoming oversold.
- Key resistance: $4,724 (immediate), $4,756 (MA20).
- Key support: $4,700 (psychological), $4,660 (daily zone).
- Expected range based on ATR: $4,695–$4,743 for this session.
Conclusion
The gold price is under clear technical pressure as American trading begins. With momentum fading and the $4,724 level now acting as resistance, sellers hold the advantage. Traders should watch for a retest of that level for a fresh short entry, or a break below $4,710 for aggressive continuation. Until we see a close above $4,756, the path of least resistance remains lower. Stay cautious — the next few hours could define the weekly trend.
Frequently Asked Questions
- What is the current gold price?
- The gold price today is $4,719.36 per troy ounce as of the American session on April 23, 2026.
- Why is the gold price falling?
- The decline is driven by a stronger US dollar, rising Treasury yields, and technical breakdown below key moving averages, with the MA20 at $4,756.50 acting as a major cap.
- What is the key resistance level for gold today?
- The immediate resistance is the broken 1-hour downside pivot at $4,724. A close above $4,756 (MA20) would shift the short-term bias.
- What support levels should gold traders watch?
- Immediate support is $4,700 (round number), followed by $4,660. The daily downside pivot target is $4,996, but that is far above current price — so focus on near-term levels first.
- Is it a good time to buy gold?
- Only if you are a scalper looking for a bounce from $4,700 with a tight stop. The medium-term trend favours sellers until the gold price reclaims $4,756. For long-term investors, consider purchasing physical gold as a hedge rather than spot trading in this uncertain environment.
Disclaimer: Trading Gold (XAU/USD) carries significant risk of loss and is not suitable for all investors. This content is for informational purposes only and does not constitute financial advice. Always conduct your own research and trade responsibly.