
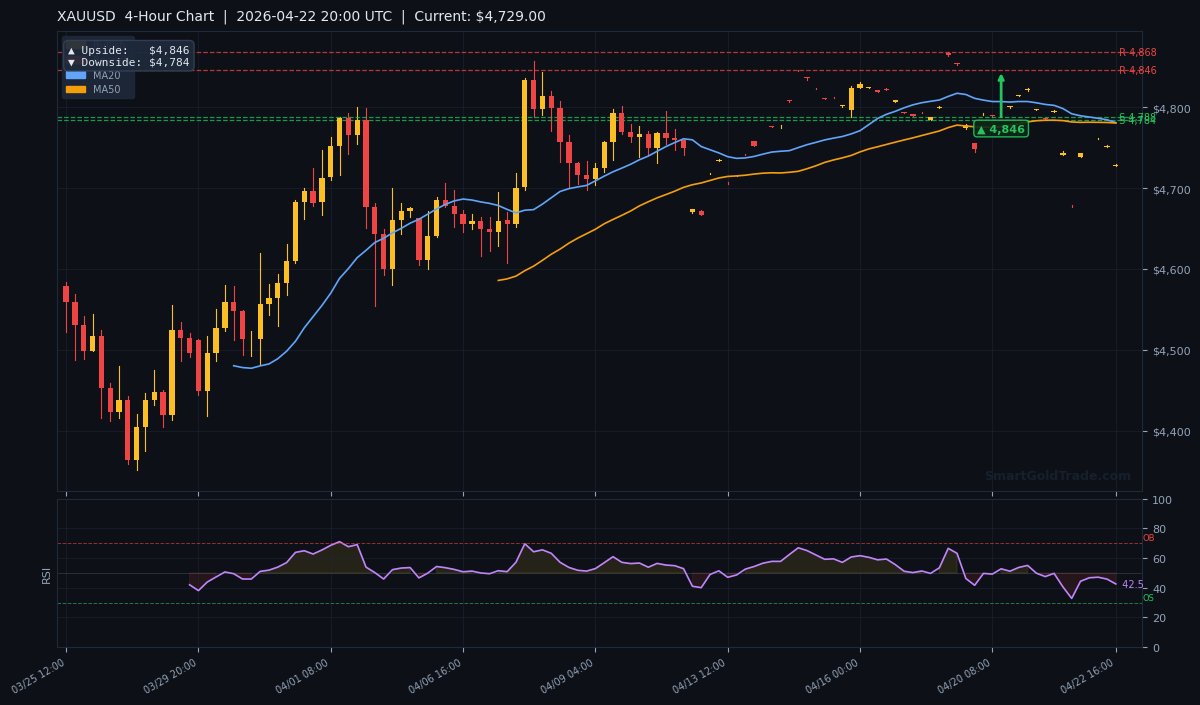
The gold price opens the American session at $4,729, trading decisively below all major moving averages as bearish momentum builds. Today's sharp decline in silver, which tanked nearly 3.50%, has spilled over into the broader precious metals complex, reflecting market anxiety over the fragile US-Iran ceasefire set to expire. For the NY session, the focus shifts to whether gold can defend immediate support or if the breakdown accelerates toward deeper technical targets.
Gold Market Overview
Macro Context
The US Dollar Index (DXY) remains a primary headwind for gold, with Treasury yields holding firm as markets reassess the Federal Reserve's timeline for any policy easing. Last week's hotter-than-expected inflation data has already been priced in, leaving traders in a wait-and-see mode. Geopolitical risk, however, provides a counterweight. The uncertainty surrounding the outcome of US-Iran talks and the impending ceasefire expiration is injecting volatility, creating a push-pull environment for safe-haven assets.
This creates a complex backdrop where traditional correlations can break down. While a strong dollar typically pressures gold, escalating Middle East tensions can trigger flight-to-quality flows that override currency effects. The key is to watch which narrative gains dominance during the high-liquidity American session.
Session Outlook
The American session brings the day's peak liquidity, often amplifying intraday trends. With an Average True Range (ATR) of $24.48, we can expect a potential daily range of approximately $47. The absence of tier-1 US economic data today means price action will be driven by technical flows, geopolitical headlines, and broader risk sentiment.
Watch for momentum to accelerate if key support at $4,784 gives way, potentially triggering stop-loss orders and a swift move lower.
Gold Price Technical Analysis
The technical picture for gold has turned bearish across multiple timeframes. Price is currently trading below the short, medium, and long-term moving averages, indicating sustained selling pressure.
Moving Average Structure
The MA20 sits at $4,780.87, the MA50 at $4,780.42, and the MA200 at $4,770.18. The fact that the price is below all three is a classic bear market signal. However, note the structure: the MA20 at $4,780.87 is slightly above the MA50 at $4,780.42, indicating a faint short-term bullish momentum crossover that is being overwhelmed by the broader downtrend. This creates a confluence of resistance between $4,770 and $4,781.
RSI and Momentum
The RSI(14) reads 42.6, placing it in neutral territory but leaning toward oversold. This suggests there is room for further downside before the market is considered technically exhausted. It does not yet signal a bounce, but traders should watch for divergence if the gold price makes a new low while RSI holds above 40.
Key Price Levels
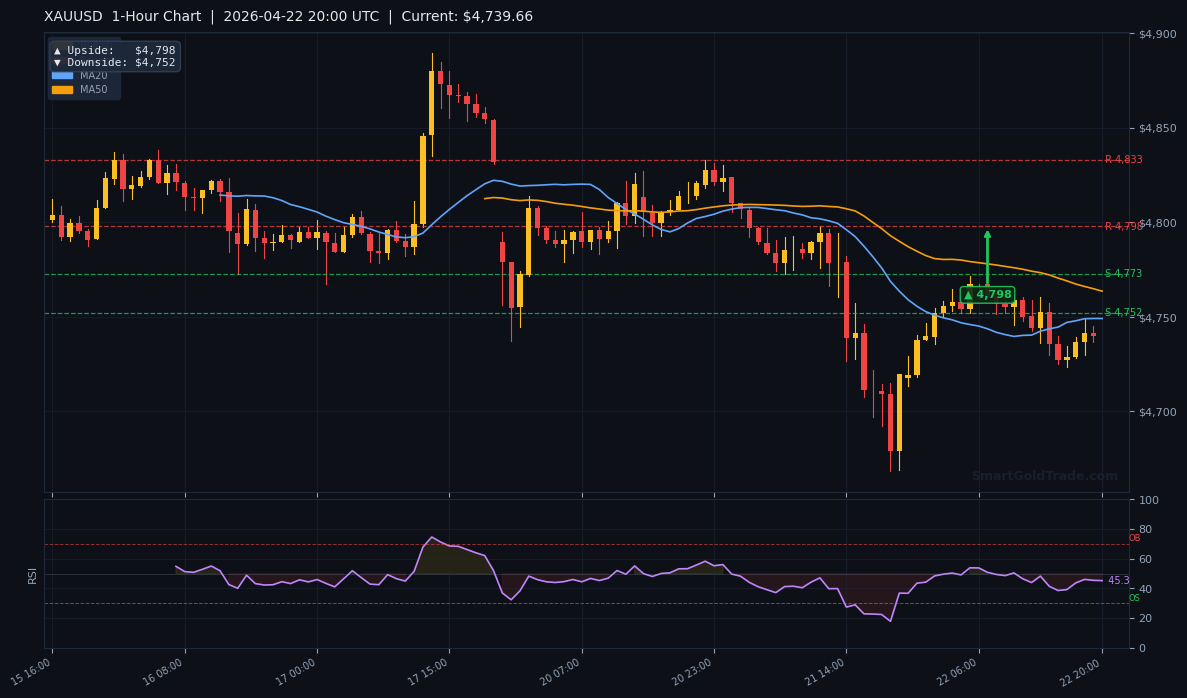
Immediate resistance is layered between $4,770.18 (MA200) and $4,780.87 (MA20). A clean break above this zone is needed to shift the short-term bias. The first major resistance R1 is at $4,868.16. On the downside, the nearest supports are S1 at $4,787.61 and S2 at $4,784.22. These levels are critical; a sustained break below S2 opens the path toward the 1-hour chart downside target of $4,752.
| Timeframe | Upside Target | Downside Target |
|---|---|---|
| Daily | $5,238 | $4,996 |
| 4-Hour | $4,846 | $4,784 |
| 1-Hour | $4,798 | $4,752 |
What Moves the Gold Price?
The primary fundamental driver remains geopolitical. The source material highlights market uncertainty due to US-Iran talks and a ceasefire on the brink of expiration. This event has already occurred and its impact is being felt today, contributing to the sharp sell-off in silver and the pressure on gold. When geopolitical tensions are high but contained, gold can sometimes sell off as traders rotate into cash or the dollar. A sudden escalation, however, would trigger a violent reversal.
The Federal Reserve's stance continues to loom large. With last week's data now processed, traders are looking ahead to the next clues on inflation and employment. The strong dollar environment, supported by relatively higher US yields, remains a structural challenge for dollar-denominated gold.
Key Factors That Influence the Gold Price
The gold price typically moves inversely to the US Dollar. When the DXY strengthens, it often puts downward pressure on gold, making it more expensive for holders of other currencies. Conversely, dollar weakness tends to lift the gold price as global investors seek a reliable store of value.
Inflation and interest rates play a dual role. Rising inflation usually fuels demand for gold as an inflation hedge, pushing the gold price higher. But when real yields climb—like when the Fed signals tighter policy—gold can lose appeal because it yields nothing. Geopolitical uncertainty is another powerful trigger: crises from the Middle East to Eastern Europe have historically sent the gold price surging as capital rushes to safety.
Physical demand also matters. Central bank purchases and jewelry demand underpin the gold price over the long term. For those looking to own tangible assets, our physical gold store provides Shariah-compliant coins and bars, helping you secure wealth independently of short-term market swings. Whether you're buying for protection or building a diversified portfolio, understanding these fundamentals can give you an edge in tracking the gold price.
Key Event to Watch
This week, the most critical event will be any official announcement or breakdown regarding the US-Iran ceasefire. A formal extension would likely remove a key support pillar for gold, encouraging more technical selling. Conversely, a collapse of talks and a return to hostilities would see a rapid, explosive bid for safe-haven assets, potentially catapulting the gold price back above the moving average cluster.
Devil's Advocate
The prevailing bearish bias hinges on gold's inability to reclaim the moving average cluster around $4,780. What could invalidate this? A sudden, sharp geopolitical headline that triggers a risk-off panic would be the most likely catalyst. In such a scenario, watch for a swift break and hourly close above $4,787.61 (S1), which would trap shorts and fuel a short-covering rally toward $4,798 and then $4,846.
The neutral RSI at 42.6 also leaves ample room for a momentum shift without being overextended. If buyers step in aggressively at the $4,752 area (the 1-hour downside target), it could form a double bottom and stage a significant counter-trend move, flipping the near-term narrative.
Trading Strategy for American Session
Given the bearish structure and price trading below key MAs, the preferred bias for the NY session is to sell rallies. An ideal entry zone exists on a retest of the resistance confluence between $4,770 and $4,781. A sell order can be placed at $4,775, with a stop loss placed at $4,795 (just above the MA20 and S1). This provides a 20-point risk.
The primary take-profit target is the 1-hour chart downside target at $4,752, offering a 23-point reward. A secondary target is the extension toward $4,730. This setup yields a risk-reward ratio of approximately 1:1.15 on the first target. For traders seeking a halal gold trading approach that avoids leverage, this would correspond to adjusting physical allocation or using a spot trading platform. To complement technical setups, professional gold trading signals can provide timely entry and exit confirmations.
Key Takeaways
- The gold price starts the American session at $4,729, in a bearish position below all major moving averages.
- Key resistance is a tight band between $4,770 (MA200) and $4,781 (MA20/MA50); a break above is needed to shift bias.
- Immediate support levels are $4,787.61 (S1) and $4,784.22 (S2); a break below targets $4,752.
- The RSI at 42.6 is neutral, indicating room for further downside before being oversold.
- Geopolitical tension from US-Iran talks is the main fundamental driver, with the ceasefire expiration being the key risk event.
- Expected daily volatility range, based on the ATR of $24.48, is approximately $47.
Conclusion
The technical evidence points to continued downside pressure for gold in the near term, with the American session likely to test the resolve of bulls at key support levels. The confluence of moving averages now acts as a formidable