
The gold price has settled at $4,742.94 as the American session gets underway, trading decisively below all its major moving averages. The metal is digesting last week's geopolitical turbulence surrounding the Strait of Hormuz and the US seizure of an Iranian vessel, which failed to provide lasting support. This session, the focus shifts to the technical breakdown, with the key question being whether bears can sustain pressure below the $4,784 support cluster or if bulls can muster a recovery rally.
Last week's data, including the PPI and retail sales figures, confirmed the Fed's higher-for-longer stance remains intact, pressuring non-yielding assets. The immediate outlook hinges on whether New York liquidity amplifies the current downtrend or triggers a technical rebound from oversold intraday conditions. Traders should prepare for volatility, with the daily ATR suggesting a potential $28.45 range.
Gold Market Overview
Macro Context
The US Dollar Index (DXY) remains a primary headwind for gold, holding gains as Treasury yields find stability. Last week's data flow reinforced the narrative of sticky inflation, leaving the Federal Reserve with little room to signal imminent rate cuts in its upcoming communications. This has solidified real yields, which move inversely to gold, in positive territory.
Geopolitical risk, evidenced by the weekend's events in the Strait of Hormuz, provided only a fleeting bid. This indicates the market is currently in a 'sell-the-news' mode concerning flare-ups, prioritizing monetary policy over geopolitical friction. The structural outflow from gold ETFs continues, reflecting a shift in institutional sentiment towards yield-bearing assets in the current macro climate.
Session Outlook
The American session typically brings heightened volatility and decisive price action. With no tier-1 US data scheduled for today, price action will be driven by technical flows, adjustments in USD positioning, and any unscheduled geopolitical or central bank headlines. The thin event calendar often leads to exaggerated moves as traders commit to positions without fundamental interference.
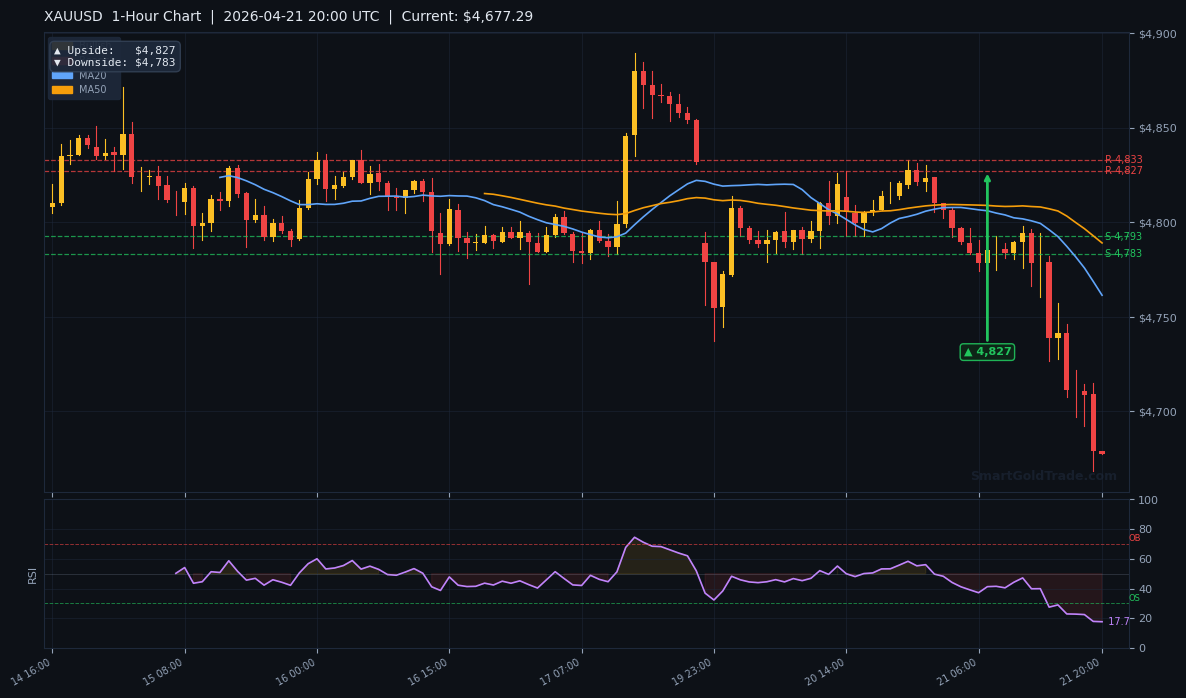
Liquidity will build through the New York morning, with the most significant directional moves often occurring between 10:00 and 15:00 EST. The key trigger will be whether the price can reclaim the $4,784 level. A failure to do so will invite further selling towards the session's expected volatility low. Watch for momentum on the 1-hour chart to gauge the session's dominant force.
Technical Analysis
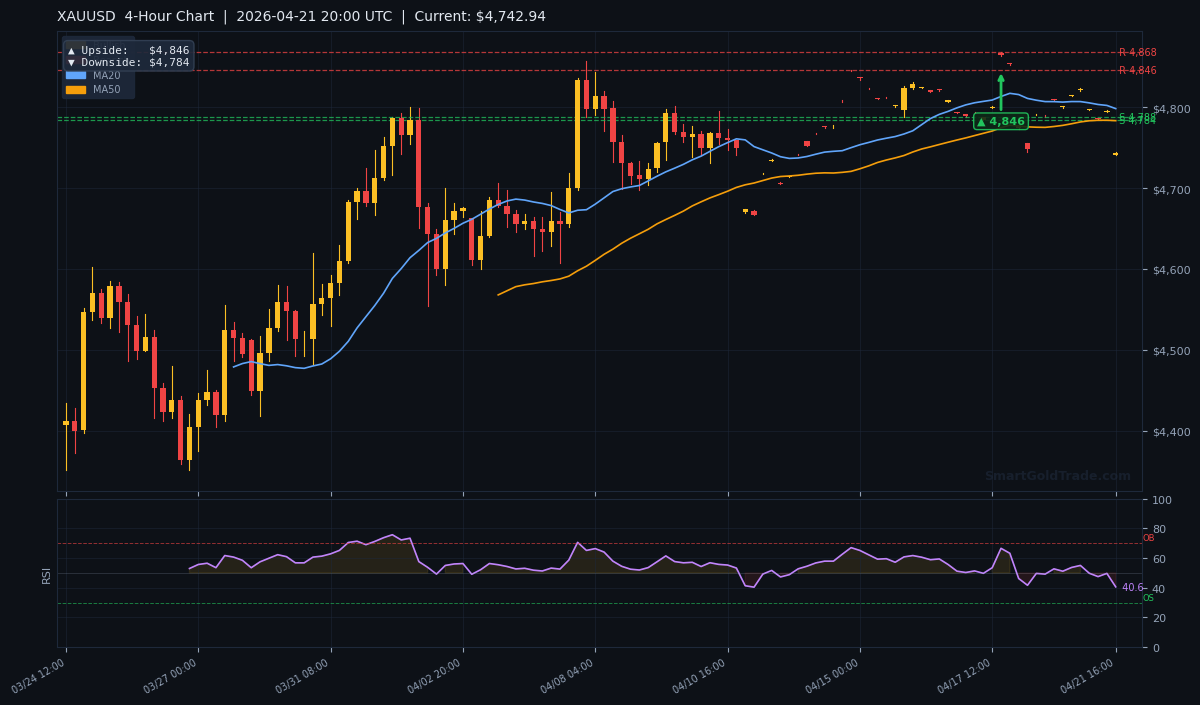
Gold's technical posture is bearish across multiple timeframes, confirmed by its position relative to the core moving averages. The current price of $4,742.94 is trading below the MA20 ($4,798.29), the MA50 ($4,783.36), and critically, the MA200 ($4,781.18). This alignment signifies strong bearish control in the short, medium, and long-term trends.
Moving Average Structure
The moving average structure tells a clear story. The price is submerged beneath all three key averages: MA20 at $4,798.29, MA50 at $4,783.36, and MA200 at $4,781.18. This is classic bear market territory. However, note that the EMA Structure shows MA20 > MA50, which indicates underlying short-term bullish momentum trying to emerge—a potential source of conflict that could fuel a sharp counter-trend rally if triggered.
RSI and Momentum
The RSI(14) reads 40.6, placing it in neutral territory and far from oversold conditions. This suggests there is ample room for the downtrend to extend before the market is considered oversold on this timeframe. It does not yet provide a contrarian buy signal; instead, it confirms the bearish momentum has not yet exhausted itself. A dip below 30 would be needed to flag a potential short-term reversal setup.
Key Price Levels
Resistance is clearly defined. R1 sits at $4,868.16 and R2 at $4,845.67. Any bullish attempt will face immediate selling pressure at these levels. On the support side, S1 is $4,787.61 and S2 is $4,784.22. The fact that the current price is already trading below this support cluster is a significant bearish development.
The ATR(14) of $28.45 defines the expected daily volatility range. This means a daily range of approximately $57 (2 x ATR) is statistically normal. For today's session, this projects a potential high near $4,771 and a low near $4,714 if the average volatility is realized.
| Timeframe | Upside Target | Downside Target |
|---|---|---|
| Daily (D1) | $5,238 | $5,014 |
| 4-Hour (H4) | $4,846 | $4,784 |
| 1-Hour (H1) | $4,827 | $4,783 |
Fundamental Drivers
The primary fundamental weight on gold remains the recalibrated outlook for Federal Reserve policy. Last week's economic data, now in the rearview mirror, cemented the view that the first-rate cut is unlikely before late 2026. This has caused a sustained outflow from gold-backed ETFs, as the opportunity cost of holding a non-yielding asset increases.
The weekend's geopolitical incident—the closure of the Strait of Hormuz and the US seizure of an Iran-flagged vessel—proved to be a non-event for gold prices beyond an initial gap. This muted reaction is telling; it suggests the market is heavily discounting geopolitical risk premiums in favor of the dominant monetary policy narrative. The strong inverse correlation with the US Dollar is currently the most reliable fundamental guide.
Key Event to Watch
This week, the core event for gold traders will be the US Q1 GDP Advance estimate, followed by the PCE Price Index data. These releases will either reinforce the 'higher-for-longer' Fed narrative or introduce doubts about economic resilience. A significantly weaker-than-expected GDP print could temporarily weaken the USD and provide gold a relief rally, but sustained bullish momentum would require a soft PCE reading that revives 2026 rate-cut hopes.
Devil's Advocate
The prevailing bearish bias hinges on the price staying below the $4,784 support-turned-resistance zone. What could invalidate this? A decisive hourly close above $4,787.61 (S1) would be the first warning sign, suggesting the breakdown was a false move. A subsequent push above the cluster of moving averages near $4,798 would confirm a bear trap and likely trigger a short-covering rally towards R2 at $4,845.67.
This reversal scenario would likely require a sudden, sharp downturn in the US Dollar, perhaps triggered by an unexpected dovish comment from a Fed official or weaker-than-anticipated US data. Traders married to the short side must respect these levels; a breach here would flip the script and force a rapid reassessment of market structure.
Trading Strategy for American Session
Given the technical breakdown below key supports, the preferred strategy for the NY session is to look for selling opportunities on any retracement towards the broken support zone. The ideal entry zone is between $4,784 and $4,790, where the old S1/S2 levels now act as resistance.
Place a stop loss at $4,800, just above the MA20 and the psychological $4,800 level. This provides a logical invalidation point for the bearish setup. The primary take-profit target is set at $4,727, calculated by extending one full ATR ($28.45) below a conservative entry at $4,784. A secondary, more aggressive target would be the weekly low if momentum accelerates.
For traders preferring a halal gold trading approach without leverage, this setup translates to waiting for a bounce to the $4,784-4,790 zone to sell physical gold or take a short position in a spot market, with the same risk management principles. Risk-reward on this setup exceeds 1:2, making it statistically viable.
Key Takeaways
- The gold price is in a confirmed bearish structure, trading below the MA20, MA50, and MA200 at $4,742.94.
- Immediate resistance is the former support cluster at $4,784 - $4,788; a break above this is needed to negate the bearish outlook.
- The RSI at 40.6 is neutral, indicating the downtrend has room to extend before becoming oversold.
- Expected daily volatility, per the ATR, is $28.45, projecting a potential low near $4,714.
- The primary NY session strategy is to sell a retest of $4,784 resistance, targeting $4,727 with a stop at $4,800.
- A close above $4,800 would invalidate the bearish setup and likely trigger a short-covering rally toward $4,846.
Conclusion
Gold enters the American session in a technically vulnerable position. The failure to hold $4,784 support has opened the door for a test of lower levels, with $4,727 emerging as the initial target. While the weekend's geopolitical noise provided no lasting lift, the metal remains at the mercy of the US Dollar and real yields. Traders should monitor the $4,784-4,790 zone with a bearish bias; a rejection here offers a high-probability setup. However, discipline is paramount—a sustained move above $4,800 would signal a failed breakdown and require an immediate shift in strategy. For those seeking automated execution of such technical setups, tools like an automated candlestick pattern detection system can help remove emotion from the process.
Frequently Asked Questions
- What is the key support level for gold right now?
- The critical support cluster that has broken is $4,784 - $4,788. This former support now acts as the primary resistance. The next major support does not appear until the $4,714 area, based on current ATR projections.
- Is gold oversold and due for a bounce?
- Not according to the 4-hour RSI. At 40.6, it is in neutral territory. A bounce is always possible, but the indicator suggests there is still room for the downtrend to continue before reaching oversold (typically below 30) conditions that would favor a stronger reversal.
- What price would turn the short-term trend bullish?
- A clear hourly close above the MA200 at $4,781.18 and the resistance zone at $4,787 would be the first step. A more definitive bullish signal would be a break and hold above the MA20 at $4,798.29.
- How can I manage risk trading gold in this environment?
- Use the ATR value of $28.45 to set your stop losses. Placing a stop 1 to 1.5 x ATR away from your entry provides enough room for normal volatility while protecting your capital. For a short entry near $4,784, a stop at $4,800 (just over 0.5 x ATR above) is a prudent calculation.
- What's a good resource for beginners to follow expert trades?
- For traders looking to learn by observing, our copy trading platform allows you to follow and automatically replicate the trades of verified, top-performing gold traders, providing a practical way to understand strategy implementation.
Trading Gold (XAU/USD) carries significant risk of loss and is not suitable for all investors. This content is for informational purposes only and does not constitute financial advice. Always conduct your own research and trade responsibly.