
The gold price opened the Asian session quietly, hovering around $4,738 after another test of lower levels. Traders are digesting the looming expiration of the Middle East ceasefire agreement this week, an event that has kept a mild bid under safe-haven assets. With liquidity thinning out in the Asian hours, the stage is set for a patient, range-bound session where chasing momentum is a recipe for losses. The technical structure, however, warns of further downside pressure unless bulls can muster a swift recovery.
Last week's price action failed to sustain a break above key moving averages, leaving the market in a vulnerable position. The focus now shifts to whether dip-buyers will appear ahead of the European open or if the bearish momentum will extend towards the next significant support cluster. This session is less about explosive moves and more about positioning for the volatility that may come with the day's upcoming economic data and geopolitical headlines.
Gold Market Overview
Macro Context
The US Dollar Index (DXY) has shown resilience, capping upside momentum for dollar-denominated gold. Persistent 'higher-for-longer' rhetoric from Federal Reserve officials continues to underpin US Treasury yields, creating a headwind for non-yielding bullion. While geopolitical risk from the Middle East provides a floor, the market's reaction has become somewhat muted, suggesting these tensions are already partially priced in.
The primary macro driver remains the trajectory of US interest rates. Any data suggesting a re-acceleration of inflation or economic strength could further push back Fed rate cut expectations, strengthening the dollar and pressuring gold. Conversely, signs of a cooling labor market or softer inflation could renew the gold bull case, but such a catalyst is not on the immediate horizon for the Asian session.
Session Outlook
The Asian session is typically characterized by lower liquidity and narrower ranges. With major economic centers like Tokyo and Shanghai active, but without high-impact data scheduled, price action is likely to be technically driven and reactive to any unexpected headlines regarding geopolitics. The expected daily range, derived from the Average True Range (ATR), is approximately $32.
Traders should not expect trend-defining moves during these hours. Instead, the session will likely consolidate and probe key technical levels defined in the prior US session. The thin conditions mean moves can be exaggerated by modest order flow, so risk management is paramount. Patience is the key virtue; wait for the market to come to your level rather than chasing price.
Technical Analysis
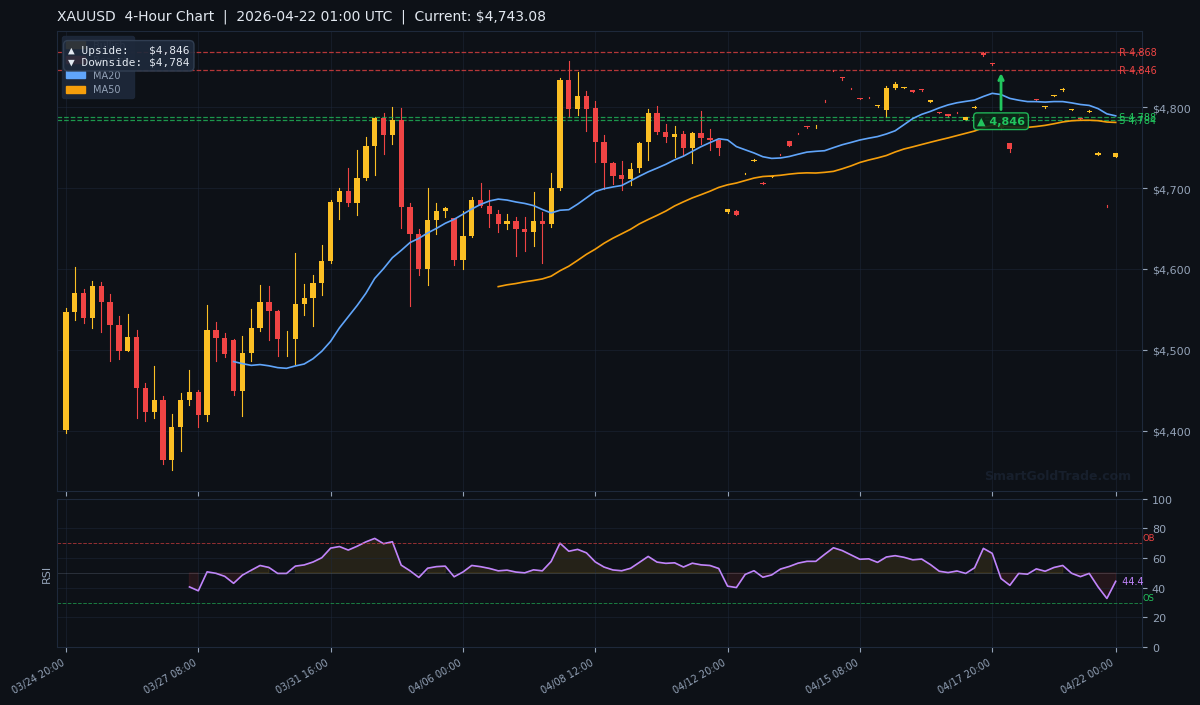
The live technical picture for XAUUSD presents a cautious-to-bearish bias on the higher timeframes. The current price on the H4 chart is $4,743.08, which sits below all major simple moving averages. This positioning below key averages suggests the bears are in control of the near-to-medium-term narrative, and rallies may be sold into until proven otherwise.
Moving Average Structure
The moving averages paint a clear picture of overhead resistance. The MA20 sits at $4,789.33, the MA50 at $4,781.20, and the long-term MA200 at $4,777.53. The fact that the price is trading below the MA200 confirms we are in established bear territory on this timeframe. Notably, the MA20 is above the MA50, indicating some short-term bullish momentum trying to emerge, but it has so far failed to lift price sustainably above the heavier MA50 and MA200.
RSI and Momentum
The RSI(14) reads 44.4, firmly in neutral territory. This indicates there is no immediate overbought or oversold condition, giving the market room to move in either direction. It does not suggest a reversal is imminent, but rather that the current bearish momentum has not yet reached an exhausted state. A break below 30 would signal strengthening downside momentum, while a push above 55 would be needed to suggest bullish momentum is building.
Key Price Levels
Our indicator suite defines clear levels to watch. Immediate resistance is at R1: $4,868.16, with secondary resistance at R2: $4,845.67. On the support side, the first crucial level is S1: $4,787.61, followed by S2: $4,784.22. The convergence of S1, S2, and the MA200 creates a significant support zone around $4,784-$4,788. A clean break below this cluster would open the path toward the 4-hour chart downside target.
| Timeframe | Upside Target | Downside Target |
|---|---|---|
| Daily | $5,238 | $4,996 |
| 4-Hour | $4,846 | $4,784 |
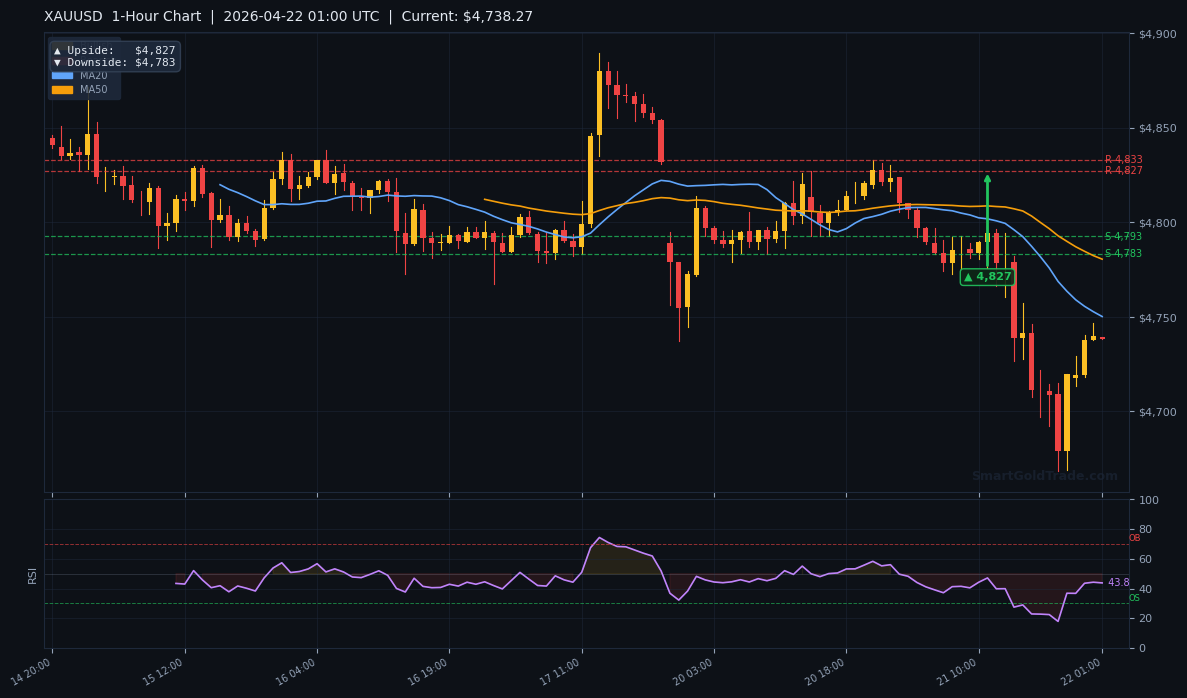
| 1-Hour | $4,827 | $4,783 |
Fundamental Drivers
The primary fundamental overlay remains geopolitical. The market is closely monitoring the situation in the Middle East, with a 14-day ceasefire agreement set to expire. The risk of a resumption in conflict is providing underlying, albeit fading, support for gold as a safe haven. The market's tepid response suggests traders are awaiting a definitive trigger rather than pricing in a full escalation preemptively.
From a monetary policy perspective, the Fed's firm stance continues to be the dominant force. Strong US economic data has pushed expectations for the first rate cut further into the future, keeping real yields elevated and the dollar buoyant. This environment is inherently challenging for gold, requiring a major risk-off event or a sudden dovish shift from the Fed to spark a sustained rally.
Key Event to Watch
This week, traders will watch the German and Eurozone ZEW Economic Sentiment surveys, due later today. While not a top-tier market mover like US CPI, a significant miss or beat could influence the Euro and, by extension, the DXY. A weaker-than-expected ZEW reading could weigh on the Euro, boost the dollar index, and add indirect downward pressure on the gold price. However, its impact is likely to be short-lived unless it dramatically alters the European Central Bank's policy outlook.
Devil's Advocate
The prevailing bearish technical bias faces one major invalidation point: a decisive breakout above the $4,787-$4,789 resistance zone. This area encompasses the S1 level and the MA200. A sustained move above this confluence, particularly on a closing basis, would signal that the bearish structure is failing and could trigger a short-covering rally toward the next resistance at $4,846.
The catalyst for such a move would likely be an unforeseen geopolitical escalation or a sudden, sharp drop in the US dollar. If headlines cross indicating a collapse of the ceasefire and a rapid expansion of conflict, the flight-to-safety bid could overwhelm the technical selling pressure. In this scenario, traders positioned for further downside would need to exit quickly.
Trading Strategy for Asian Session
Given the bearish alignment below the moving averages and the neutral RSI, the strategic preference in the Asian session is to look for selling opportunities on any failed rallies toward resistance. The ideal sell zone is below the $4,787 resistance cluster. An entry in the $4,775 - $4,785 range offers a favorable risk-reward profile, targeting a move back towards the recent lows and the 1-hour downside target of $4,783.
A stop loss should be placed above $4,819 (approximately one ATR above the entry), providing room for normal volatility while protecting against a false breakdown. Primary take-profit targets are set at $4,744 (minor support) and $4,730 (extension). For those seeking a more conservative approach, waiting for a clear break and close below $4,784 before entering offers confirmation but a less advantageous entry price.
Conversely, a bullish strategy would only be considered on a break and hold above $4,789, targeting a move to $4,827. However, this is the lower-probability scenario during this thin session and requires patience for confirmation. For investors looking at longer-term, low-entry gold accumulation strategies outside of leveraged speculation, our managed gold trading plans offer a structured, Shariah-compliant approach.
Key Takeaways
- The gold price is in a precarious position, trading below all major moving averages including the MA200 at $4,777.53.
- Key support converges at $4,784-$4,788 (S1, S2, MA200); a break here targets $4,744.
- The RSI at 44.4 is neutral, offering no immediate reversal signal and allowing for further downside.
- Daily expected volatility, per the ATR, is $32.05, warning against tight stops in low-liquidity sessions.
- Geopolitical risk from the Middle East provides a floor, but the market's muted reaction suggests it is largely priced in for now.
- The Asian session strategy favors selling failed rallies below $4,787 with stops above $4,819.
Conclusion
The technical evidence points toward continued vulnerability for the gold price. The failure to reclaim the $4,787-$4,789 zone as support keeps the bears in control for the near term. While geopolitical tensions prevent a collapse, the overarching macro forces of a resilient dollar and delayed Fed cuts create a significant headwind. The path of least resistance, therefore, appears to be sideways to lower, with a test of the $4,784 support cluster as the next logical step.
Traders should approach the Asian session with patience, recognizing that low volume can distort price action. The setup favors a bearish bias, but execution requires discipline—waiting for price to reach defined resistance levels rather than chasing the move down. The larger trend will be decided by whether this key support zone holds or folds in the more liquid sessions to come. For traders who prefer to automate their strategy in such low-volatility, range-bound environments, using a reliable price action trading system for gold can help objectively identify entries based on candlestick patterns and supply zones.
Frequently Asked Questions
- What is the key resistance level for gold right now?
- The immediate and most significant resistance confluence is between $4,787.61 (S1) and $4,789.33 (MA20). A break above this zone is needed to shift the short-term bias to bullish.
- Is the RSI showing gold as oversold?
- No. The RSI(14) reading of 44.4 is in neutral territory. It is not yet in oversold (<30) conditions, suggesting there is room for further downside pressure before a technical bounce becomes likely.
- How is the Middle East tension affecting the gold price?
- It is providing a underlying floor of support, preventing a sharper decline. However, the market's reaction has been muted, indicating the risk is partially priced in. A significant escalation would be needed to drive a strong safe-haven rally.
- What is a safe trading range expectation for the Asian session?
- Based on the ATR of $32.05, the expected daily range is around that figure. However, in the typically quieter Asian session, a range of $15-$20 around the opening price near $4,738 is more likely before European liquidity arrives.
Trading Gold (XAU/USD) carries significant risk of loss and is not suitable for all investors. This content is for informational purposes only and does not constitute financial advice. Always conduct your own research and trade responsibly.