
The gold price holds steady at $4,823 during the thin Asian session on Monday, April 21, 2026. With liquidity historically low during these hours, the market is in a state of preparation rather than decisive action. The recent surge in US-Iran tensions, reported over the weekend, provided a brief geopolitical bid that is now being digested. This session is about patience, watching for clean setups, and avoiding the temptation to chase moves that lack volume confirmation.
Traders are balancing last week's stronger-than-expected US Dollar against persistent Middle Eastern conflict risks. The calm provides an opportunity to analyze the technical landscape with clarity before European and US traders return. For now, the path of least resistance remains cautiously higher, but the immediate task is navigating a market that offers little follow-through.
Gold Market Overview
Macro Context
The US Dollar Index (DXY) shows resilience, buoyed by safe-haven flows amid renewed Middle East tensions. This typically creates a headwind for gold, but the precious metal is finding its own haven bid from the same source, creating a complex correlation. US Treasury yields have stabilized after last week's volatility, removing a key catalyst for dramatic moves. The Federal Reserve's positioning remains the dominant fundamental theme, with the market parsing every data point for clues on the terminal rate.
Geopolitical risk, specifically the escalation between the US and Iran, is the primary non-economic driver. This conflict, now extending beyond seven weeks, injects a consistent undercurrent of uncertainty. It supports gold's safe-haven narrative but does so in a market that is increasingly numb to incremental headlines. The real move will come when one side of this fundamental tug-of-war – a firm Dollar or escalating war – gains decisive traction.
Session Outlook
The Asian session is characterized by shallow order books and sporadic liquidity. Major institutional players are largely absent, meaning price moves can be exaggerated but often lack sustainability. The expected range, derived from the Average True Range indicator, is approximately $23 for the day, but the Asian window may see only a fraction of that.
Key triggers are limited to geopolitical headlines and any unexpected flow from regional central banks. Japanese traders are monitoring the weak Yen, which trades near 159.10 against the USD, but this has a muted direct impact on dollar-denominated gold. The main objective for traders in this session should be to identify clear support and resistance levels, manage risk tightly, and avoid entering trades based on momentum that cannot be sustained by volume.
Technical Analysis
Moving Average Structure
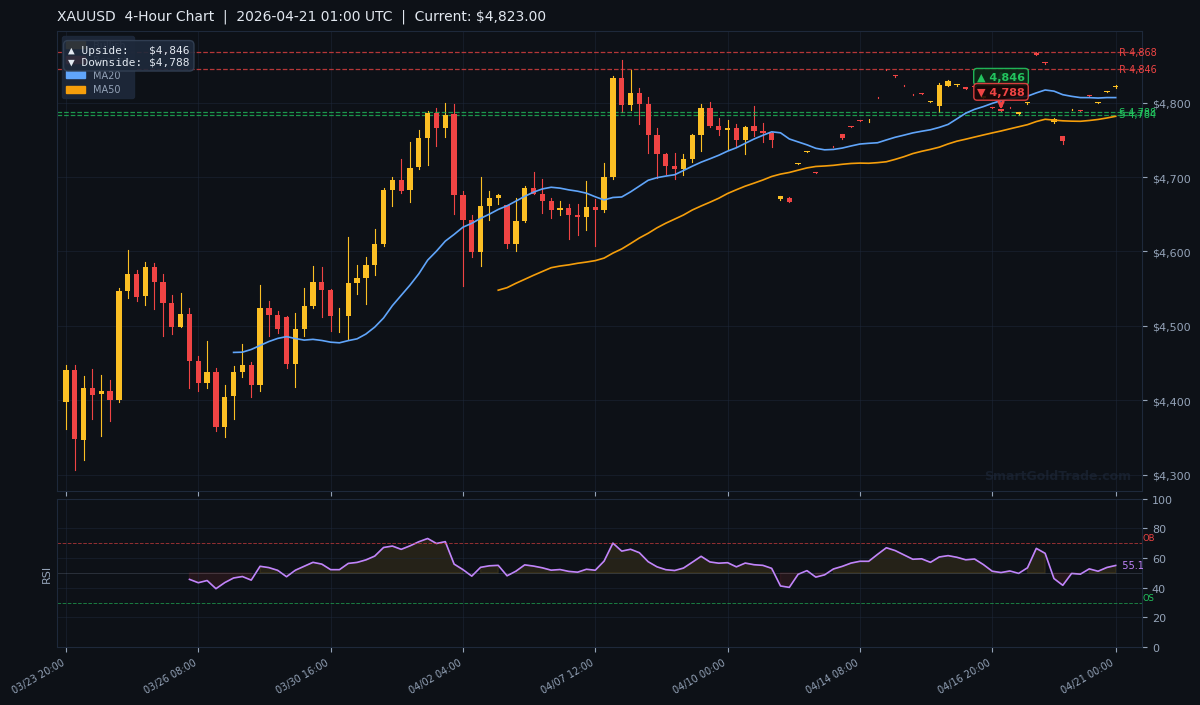
The moving average structure paints a bullish picture across all timeframes. The price at $4,823.00 sits above the MA20 at $4,806.97, confirming short-term bullish momentum. It is also comfortably above the MA50 at $4,781.79 and the critical MA200 at $4,788.61. The fact that the price holds above the long-term 200-day average is a strong confirmation of the underlying bull market.
Furthermore, the alignment of the averages is constructive: the MA20 at $4,806.97 is above the MA50 at $4,781.79. This positive gradient between short and medium-term averages indicates sustained buying pressure and a healthy uptrend structure. The 200-day average acting as a dynamic floor is the most encouraging sign for bulls.
RSI and Momentum
The RSI(14) reads 55.1, placing it squarely in neutral territory. This is neither overbought nor oversold, suggesting the market has room to move in either direction before hitting exhaustion extremes. It indicates that the recent push higher was not overly aggressive and that momentum is healthy, not feverish.
This neutral reading is ideal for traders looking for continuation setups. It means there is no immediate warning of a momentum reversal from over-extension. The ATR(14) of $23.23 defines the current volatility environment, setting realistic expectations for stop-loss placement and daily price ranges. A move of this magnitude represents a normal trading day's range.
Key Price Levels
The immediate battlefield is defined by clear support and resistance levels derived from recent price action. On the downside, Support S1 is at $4,787.61, with S2 firmer at $4,784.22. These levels must hold to maintain the short-term bullish structure. A break below S2 would signal a deeper correction is underway.
Overhead, Resistance R1 awaits at $4,868.16, but the more immediate target from the 4-hour chart is $4,846. The gap between current price and R1 is significant, highlighting the near-term target at $4,846 as the logical next step for bulls. Given the ATR, a move to test $4,846 is within the realm of a single active session's volatility.
| Timeframe | Upside Target | Downside Target |
|---|---|---|
| Daily | $5,238 | $5,014 |
| 4-Hour | $4,846 | $4,788 |
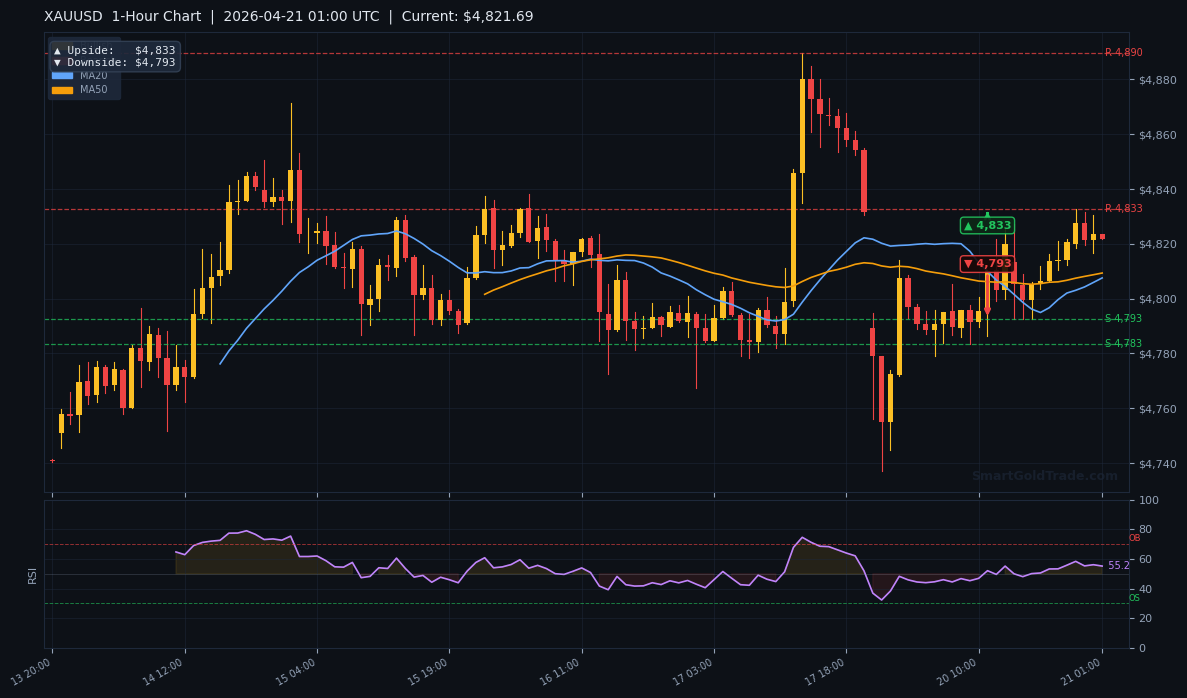
| 1-Hour | $4,833 | $4,793 |
Fundamental Drivers
The primary driver in the market is the renewed geopolitical friction between the United States and Iran. This weekend's reports of escalating tensions have reinforced gold's role as a geopolitical hedge. However, this is being counterbalanced by a firm US Dollar, which gained ground against the Japanese Yen, trading near 159.10. This creates a push-pull dynamic for dollar-denominated gold.
The stronger Dollar is a function of its own safe-haven status and relative yield attractiveness. For gold to make a sustained break higher, it needs either a deterioration in the Dollar's strength or a significant escalation in conflict that overwhelms the currency's appeal. For now, the two forces are in an uneasy equilibrium, leading to the contained, range-bound price action we observe.
Key Event to Watch
This week, the market's primary focus will shift back to economic data for clues on the Federal Reserve's path. The most critical release will be the US Core PCE Price Index data, the Fed's preferred inflation gauge. Any significant deviation from expectations could recalibrate interest rate forecasts dramatically, impacting both the US Dollar and non-yielding gold.
A hotter-than-expected print would reinforce a hawkish Fed stance, boosting the Dollar and applying pressure to gold prices. Conversely, a cooler reading could revive expectations for earlier rate cuts, weakening the Dollar and providing a fresh catalyst for gold to challenge higher resistances like $4,846 and eventually $4,868.
Devil's Advocate
The prevailing bullish structure is convincing, but it is not invulnerable. The key level that would begin to invalidate the immediate upside bias is the cluster of support between $4,788 and $4,784. This zone represents the 4-hour chart downside target and aligns closely with the MA200. A decisive hourly close below $4,784 would break the series of higher lows and signal a deeper corrective phase is underway.
Such a move would likely be triggered by a sharp de-escalation in Middle East tensions or a surprisingly hawkish shift in Fed rhetoric. It would flip the short-term trade from looking for buys on dips to selling rallies towards the MA20 at $4,807. The neutral RSI at 55.1 means there is ample room for momentum to turn negative without being oversold first.
Trading Strategy for Asian Session
Given the thin liquidity, the strategy for the Asian session must be conservative and precision-based. The ideal scenario is a pullback towards the support confluence between $4,807 (near the MA20) and $4,793 (the 1-hour downside target). An entry in this zone, with a tight stop loss placed just below the $4,784 support cluster, offers a favorable risk-reward setup.
A stop loss of $15-20 (slightly less than one ATR) is appropriate for this environment. The primary take-profit target is the 4-hour upside target at $4,846. A secondary, more aggressive target would be $4,868 (R1). It is crucial to avoid chasing the price if it gaps higher at the open; patience for a retracement is the disciplined approach in low-volume conditions.
For those interested in longer-term, hands-off strategies that align with ethical investing principles, our mudarabah investment plans offer a managed approach to gold market participation. Alternatively, traders looking for precise, real-time guidance on entries and exits might consider professional gold trading signals for tactical execution.
Key Takeaways
- The gold price is in a confirmed bull market, trading above all key moving averages including the MA200 at $4,788.61.
- Immediate technical targets are $4,846 (4-hour) and $4,833 (1-hour), with major resistance at $4,868.16 (R1).
- Critical support to watch is the zone between $4,787.61 (S1) and $4,784.22 (S2); a break below invalidates the short-term bullish setup.
- Market dynamics are balanced between geopolitical risk (bullish for gold) and a firm US Dollar (bearish for gold).
- The Asian session's thin liquidity warns against chasing moves; patience for pullbacks to support is the preferred strategy.
- This week's US Core PCE Price Index data is the key fundamental event that could break the current equilibrium.
Conclusion
The technical landscape for gold is constructively bullish, with price firmly above its long-term average and momentum indicators in a healthy state. The immediate path points towards a test of $4,846, but the journey there in the Asian session will be dictated by order flow in a thin market. Traders must exercise discipline, placing a premium on well-defined entry zones and strict risk management.
The broader outlook remains positive as long as the $4,784 - $4,788 support fortress holds. The fundamental tug-of-war between a strong Dollar and geopolitical uncertainty will eventually resolve, providing the catalyst for the next significant leg. Until then, the market offers strategic setups for those willing to wait for price to come to them, rather than forcing trades in unpredictable, low-volume conditions.
Frequently Asked Questions
- What is the key support level for gold right now?
- The most critical support zone is between $4,787.61 and $4,784.22. A break below this area, especially on a closing basis, would signal a deeper correction.
- What is the next upside target for gold price?
- The next significant technical target is $4,846, derived from the 4-hour chart analysis. Beyond that, major resistance sits at $4,868.16 (R1).
- Is the current gold price overbought?
- No. The RSI(14) reading of 55.1 is neutral, indicating there is room for further upside before the market becomes technically overbought.
- How does the strong US Dollar affect gold?
- A strong Dollar typically makes dollar-priced gold more expensive for holders of other currencies, which can dampen demand. Currently, this downward pressure is offset by gold's own safe-haven appeal due to geopolitical risks.
- What is a realistic stop-loss for a long trade in this environment?
- Given the ATR of $23.23, a stop loss of $15-20 below entry is prudent, ideally placed just below the key support at $4,784.
Risk Disclaimer: Trading Gold (XAU/USD) carries significant risk of loss and is not suitable for all investors. This content is for informational purposes only and does not constitute financial advice. Always conduct your own research and trade responsibly.