
The gold price opened the Asian session at $4,343.76, consolidating after last week’s explosive 19% rally. Liquidity remains thin, and no fresh catalyst has emerged, making this a session for strategic observation rather than aggressive entries. With European traders still hours away, the market is deciding whether the bullish momentum can recharge or if a deeper technical correction is brewing.
Gold Price: Market Overview
Macro Context
The U.S. Dollar Index (DXY) and Treasury yields continue to steer short-term gold price direction. Positioning is light as traders wait for next week’s Federal Reserve meeting and any escalation in geopolitical flashpoints.
The underlying bid for gold as a strategic hedge hasn’t disappeared — many investors also look to purchase physical gold to complement their trading portfolios. For now, the immediate fuel from last week’s surge appears spent, leaving the market in a natural consolidation phase.
Session Outlook
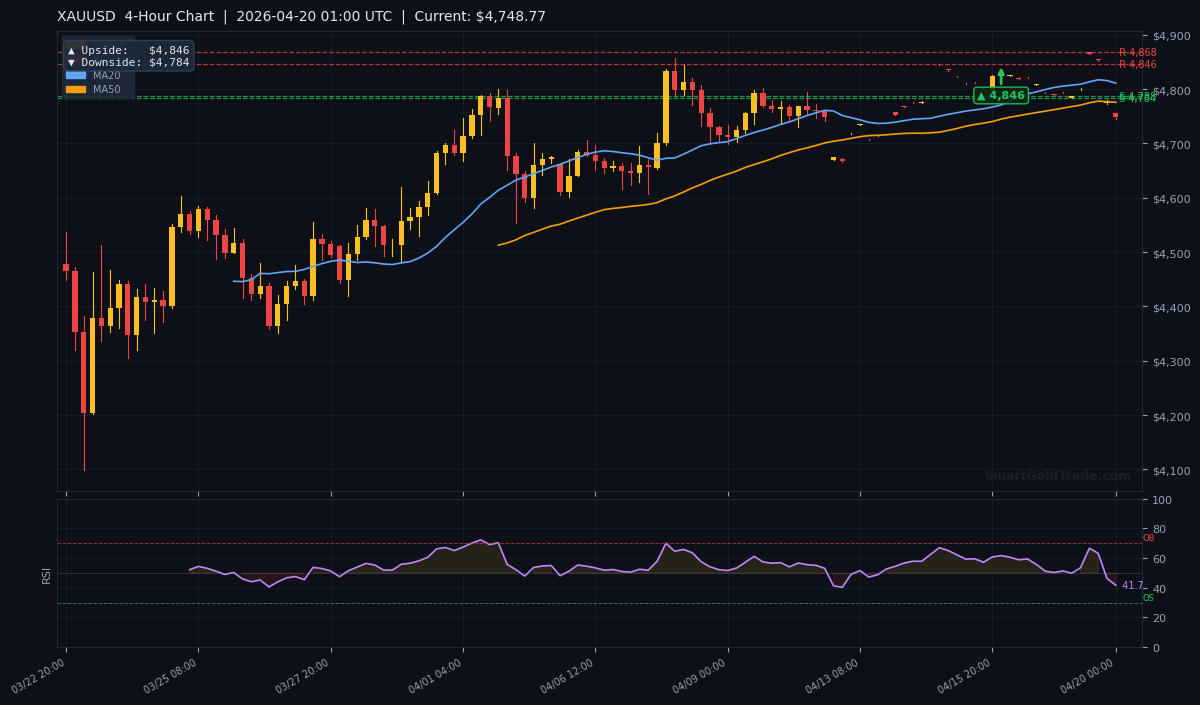
Asian hours are known for shallow order books, which can produce exaggerated moves that reverse once London opens. The Average True Range (ATR(14)) sits at $18.20, implying a full-day range near $36, but the Asian portion will likely be a fraction of that.
The key for scalpers and swing traders alike is to wait for a clean test of either $4,320 support or $4,410 resistance on the 4‑hour chart. Chasing low-volume breakouts before the European crowd arrives has burned many a screen-watcher.
Technical Analysis
The live picture leans cautious. The gold price sits below all three major moving averages, which normally signals bearish pressure — but the arrangement of those averages tells a more nuanced momentum story.
Moving Average Structure
The MA20 at $4,410 remains above the MA50 at $4,368, a sign that the rally’s short-term bullish structure is still intact on a swing basis. Still, price trading below both averages shows that sellers have wrestled control in the immediate term.
The MA200 at $4,390 acts as the long‑term pivot. A sustained close back above it would confirm the bulls are serious. Until then, the market is in a corrective phase inside a larger potential uptrend.
RSI and Momentum
The RSI(14) reads 41.7, firmly in neutral territory — not overbought, not oversold. This gives the gold price room to move in either direction before hitting extreme levels, so momentum alone isn’t offering a clear contrarian signal.
Key Price Levels
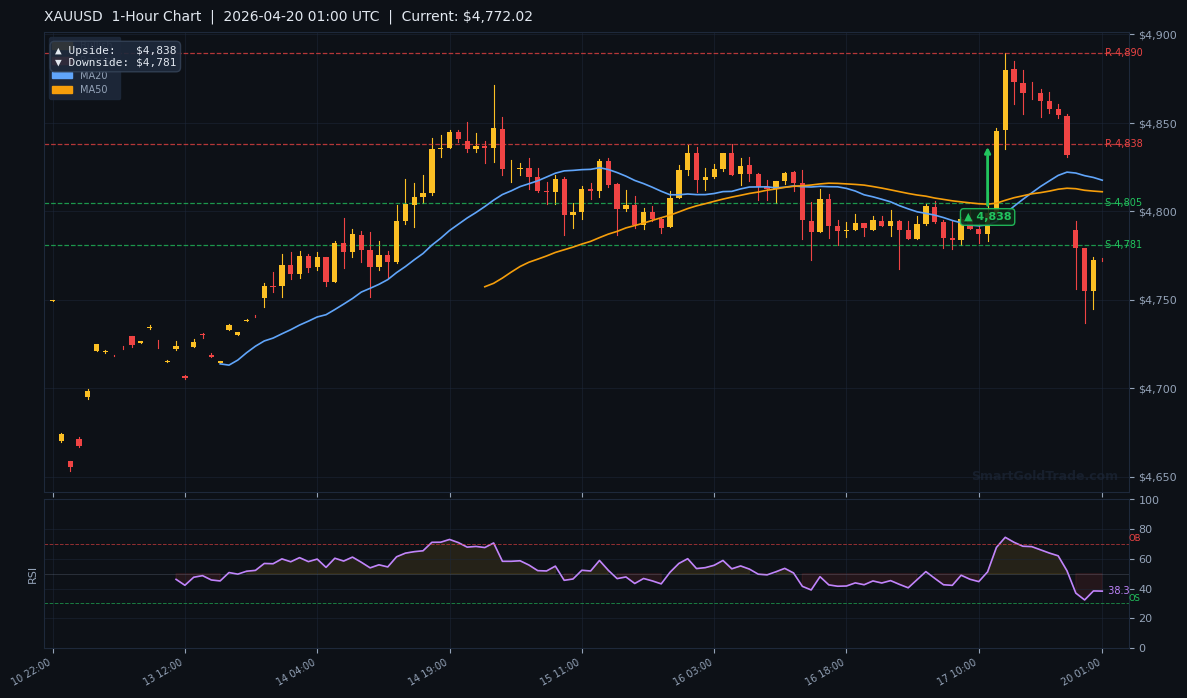
Our immediate framework is defined by a tight support zone and a nearby resistance cluster. The first layer of support sits at $4,320 (S1), with a stronger floor at $4,310 (S2). A break below S2 would open the path toward the 1‑hour downside objective of $4,300.
On the upside, resistance starts at $4,380 (R1) and firms up near the MA20 at $4,410 (R2). The table below lays out the key actionable targets across timeframes.
| Timeframe | Upside Target | Downside Target |
|---|---|---|
| Daily | $4,450 | $4,280 |
| 4-Hour | $4,410 | $4,310 |
| 1-Hour | $4,380 | $4,320 |
With an ATR(14) of $18.20, daily price swings around $36 are reasonable, although Asian ranges will be far tighter. The charts below visualize the key levels and momentum structure on both the medium‑term (H4) and short‑term (H1) views.
Fundamental Drivers
The dominant story remains the digestion of last week’s 19% surge — a move driven by a hawkish Fed repricing and a flight‑to‑safety bid. Now that the move is priced in, gold is hunting for its next catalyst. The inverse relationship with the dollar is holding, but it can decouple if geopolitical headlines intensify.
Key Event to Watch
Comments from Federal Reserve officials this week, ahead of the late‑April blackout, will be pivotal. Any hint that rate cuts are being pushed further out could cap gold below $4,380. Conversely, a patient tone would help the gold price stabilize and retest higher resistance.
Devil’s Advocate
The base case is a range‑bound grind with a slight pullback bias. But what could flip the script? A high‑volume breakout above $4,410 during the European open would signal that bulls are re‑loading, likely triggering stops and attracting momentum buyers toward $4,450.
On the bear side, a news‑driven dollar spike that knocks gold below $4,310 would invalidate the near‑term bullish structure and could drag the gold price back toward the $4,280 demand zone. Low‑liquidity sessions make such false spikes more common, so confirmation remains key.
Trading Strategy for Asian Session
Patience pays in shallow markets. The preferred approach is to wait for a confirmed test of a key level rather than chase price. A sell setup becomes attractive if the gold price rallies into the $4,380–$4,410 resistance zone and prints a rejection — a bearish pin bar or divergence on the 1‑hour chart.
Entry on confirmation, with a stop above $4,415, keeps the risk around $25–30 and targets the $4,320–$4,310 support cluster. Tools like a price action trading system for gold can help automate such pattern detection, removing guesswork from the equation.
For buy setups, we’d need a solid hold and bounce from the $4,320–$4,310 area. A bullish reversal pattern there, with a stop below $4,305, would aim for a move back toward $4,380. In these thin conditions, using limit orders to enter at predefined levels is far wiser than using market orders. Our halal gold trading platform lets you execute such strategies without leverage‑related risk, keeping the process riba‑free.
Key Takeaways
- The gold price is consolidating at $4,343.76 after a 19% weekly rally; Asian liquidity remains thin.
- Technical structure is mixed: price below all key MAs hints at bearish pressure, but the MA20 > MA50 alignment keeps the medium‑term trend intact.
- Immediate support lies at $4,320 and $4,310; resistance stands at $4,380 and the MA20 near $4,410.
- The 4‑hour chart framework gives an upside target of $4,410 and a downside target of $4,310.
- RSI at 41.7 offers no extreme signal, favouring a range‑bound or slight pullback scenario.
- Volatility, measured by ATR, is approximately $18.20, setting realistic daily swing expectations.
Conclusion
The gold price action in the Asian session calls for discipline over impulse. The market is digesting a substantial move, and low liquidity makes any breakout attempt suspect. The balance of risks tilts slightly toward a pullback to test the $4,320 support zone before the next directional move.
Traders should monitor the reaction at defined levels and wait for higher‑volume sessions to confirm direction. The broader uptrend from last week remains valid as long as price holds above $4,310. For those wanting to own the metal outright as a long‑term hedge, you can purchase physical gold through our Shariah‑compliant store — a tangible complement to active trading.
FAQ
- Is gold in a bullish or bearish trend right now?
- The short‑term trend is corrective, with the gold price trading below the MA20 at $4,410. However, the MA20 > MA50 structure and last week’s 19% surge suggest the medium‑term outlook remains bullish, pending a break above $4,410.
- What is the most important support level to watch today?
- The critical support cluster sits between $4,320 and $4,310. A decisive break below $4,310 would signal a deeper correction and open the way to the $4,300 handle.
- Should I buy gold now at $4,343?
- Chasing price in the thin Asian session rarely pays off. A more strategic approach is to wait for a pullback to the $4,320 support area for a potential entry with a tight stop, or for a clear breakout above $4,410 that confirms renewed momentum.
Risk Disclaimer: Trading Gold (XAU/USD) carries significant risk of loss and is not suitable for all investors. This content is for informational purposes only and does not constitute financial advice. Always conduct your own research and trade responsibly.