
The gold price opens the American session at $4,305.17, hovering just above a critical short-term technical battleground. Last week's market volatility, fueled by headlines from the Strait of Hormuz and Iran's nuclear posture, has settled into a tense consolidation. As liquidity returns with New York traders, the immediate question is whether gold can defend the $4,286.50 level or if a deeper test toward the 50-day moving average is imminent.
The initial bullish reaction to geopolitical developments has been dialed back, leaving price action in a compressed state. This session's price action will be decisive, setting the tone for whether bulls can regain control or if bears will force a retracement. We're watching for a clear break from this consolidation zone, with momentum likely to accelerate on any directional conviction.
Gold Market Overview
Macro Context
The U.S. Dollar Index (DXY) and Treasury yields remain the primary fundamental drivers for gold. With the Federal Reserve in a data-dependent holding pattern, every economic release is being scrutinized for hints on the timing of the next policy shift. Last week's risk-on sentiment, spurred by de-escalation headlines, provided temporary relief but hasn't altered the underlying macro calculus.
Geopolitical risk premiums, while slightly reduced, remain elevated and subject to rapid reinflation. The market's reaction shows a clear pattern of pricing in immediate headlines then reassessing the structural reality. This creates a volatile backdrop where gold can see sharp moves in both directions, anchored by its dual role as a risk-off asset and an inflation hedge.
Session Outlook
The American session brings the day's highest liquidity and volatility potential. With no tier-one economic data scheduled for today, price action will be driven by technical flows, positioning adjustments, and any breaking news. The expected daily range, based on the current ATR(14) of $21.33, suggests a potential session move between $4,283 and $4,326.
Traders should watch for a break of the Asian/European session range. A failure to hold above $4,286 could trigger stop-loss orders and accelerate selling toward the key support cluster. Conversely, a reclaim of the MA20 at $4,298.43 would signal short-term bullish momentum resumption.
Gold Price Technical Analysis
Moving Average Structure
The moving average configuration presents a mixed but ultimately bullish picture. The current price of $4,305.17 sits above the short-term MA20 at $4,298.43, regaining some near-term footing after briefly dipping below. It also remains comfortably above the medium-term MA50 at $4,272.57 and the long-term MA200 at $4,285.42.
This structure confirms the primary bull market remains intact, though the market is undergoing a short-term correction or consolidation. The fact that the MA20 is still above the MA50 ($4,298.43 > $4,272.57) maintains the short-term bullish momentum structure, but that's being tested.
RSI and Momentum
The RSI(14) reading of 51.2 places gold squarely in neutral territory, showing no immediate overbought or oversold extremes. This suggests the market has room to move in either direction before reaching exhaustion levels. A neutral RSI during price consolidation often indicates a potential energy buildup, preceding the next significant directional move.
Traders should watch for RSI divergences on any test of the key support or resistance levels. A bullish divergence (price making a lower low while RSI makes a higher low) at support would signal weakening selling momentum and a potential reversal opportunity.
Key Price Levels
The technical framework provides clear reference points for today's session. Immediate support is identified at S1: $4,281.56, followed by S2: $4,278.64. The convergence of S1 with the MA200 at $4,285.42 creates a significant support zone between $4,281 and $4,285.
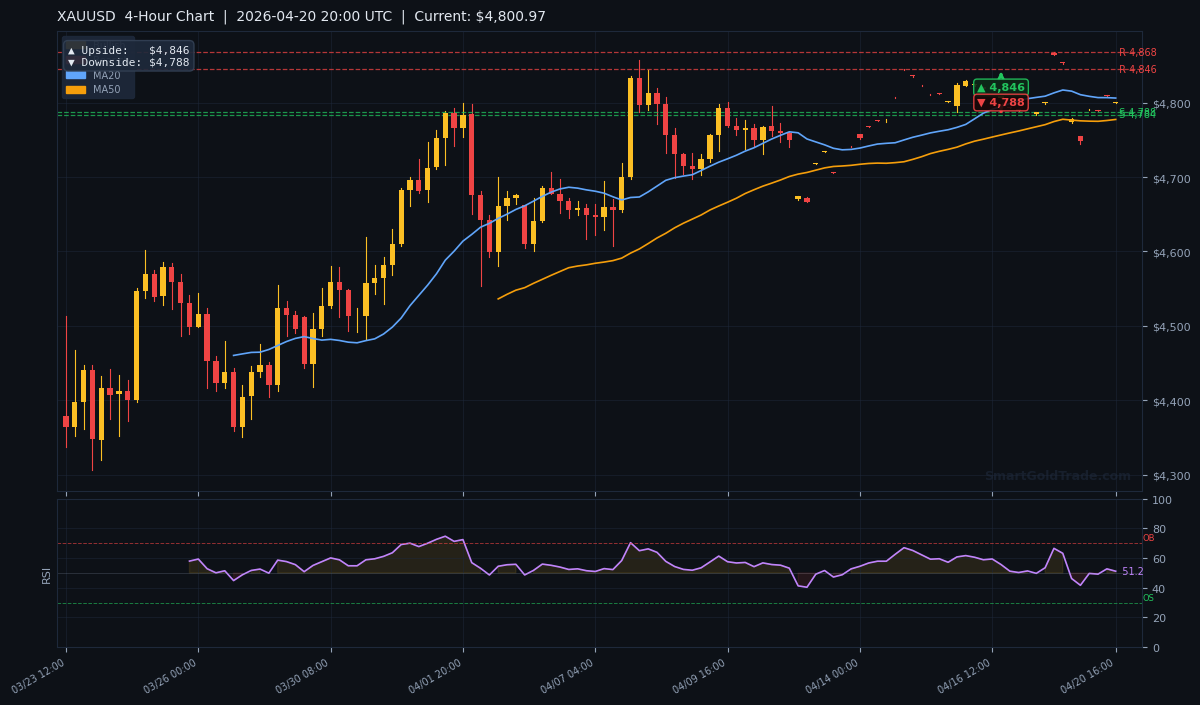
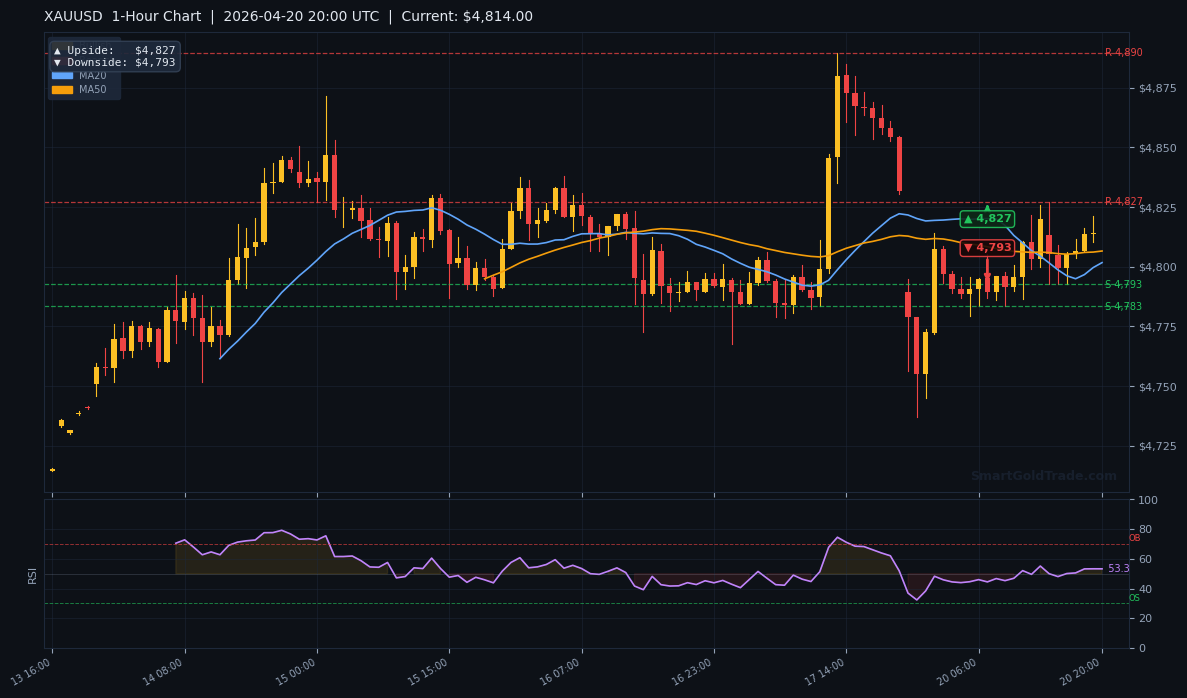
On the resistance side, R1 stands at $4,353.60 and R2 at $4,344.00. The ATR(14) of $21.33 suggests a normal daily range expectation, but breakouts can extend beyond this during high-volatility sessions. The 4-hour chart provides nearer-term targets of $4,333.89 to the upside and $4,283.61 to the downside.
| Timeframe | Upside Target | Downside Target |
|---|---|---|
| Daily | $4,695.20 | $4,484.14 |
| 4-Hour | $4,333.89 | $4,283.61 |
| 1-Hour | $4,316.90 | $4,286.50 |
Fundamental Drivers
The primary fundamental catalyst remains the shifting geopolitical landscape. Last week's headlines regarding Iran and the Strait of Hormuz provided the initial volatility spike, but the subsequent dialing back of rhetoric has left markets in a state of cautious equilibrium. This pattern of headline-driven spikes followed by retracements has become characteristic of the current environment.
The Federal Reserve's positioning continues to overshadow all other drivers. With inflation data for March already released and digested, the market's focus has shifted to growth indicators and employment data. The dollar's strength relative to other major currencies creates a headwind for gold, but safe-haven demand provides a counterbalancing force.
Key Event to Watch
This week, traders will watch the U.S. GDP advance estimate for Q1 2026, scheduled for release on Thursday. A significantly stronger-than-expected reading could reinforce hawkish Fed expectations, boosting the dollar and pressuring gold. Conversely, a weak number might revive recession concerns and boost gold's safe-haven appeal. The market's reaction function will depend on how the data influences the trajectory of future rate cuts.
Devil's Advocate
The bullish bias assumes the $4,281–$4,285 support zone will hold. What if it doesn't? A clear breakdown and close below $4,278.64 (S2) would invalidate the immediate bullish structure and signal a deeper correction is underway. This would likely target a test of the MA50 at $4,272.57 and potentially the psychological $4,250 level.
Such a move would require a fundamental catalyst—likely a sharp hawkish repricing of Fed expectations or a significant reduction in geopolitical risk premiums. The technical damage would be confirmed if the MA20 crosses below the MA50, flipping the short-term momentum structure to bearish. Traders with long positions must have contingency plans for this scenario.
Trading Strategy for American Session
Given the neutral technical setup, traders should adopt a range-bound approach with defined breakout triggers. The key is to avoid predicting direction and instead react to confirmed moves. For bullish scenarios, wait for a confirmed bounce from the $4,281–$4,285 support zone with a 1-hour close above $4,298.
Entry for long positions would be on a retest of $4,298.43 after the initial break, with a stop loss below $4,278 (using the ATR for approximately $20 risk). Initial take-profit targets are $4,316.90 (1-hour upside) and $4,333.89 (4-hour upside). For those who prefer a more automated approach to identifying technical setups, a price action trading system for gold can detect candlestick patterns and supply/demand zones without manual chart watching.
For bearish scenarios, a break below $4,278.64 with follow-through selling would trigger short entries near $4,283. The stop loss for shorts would be above $4,299, targeting $4,272.57 (MA50) and $4,257 as extension targets. Position sizing should account for the elevated volatility, with risk limited to 1-2% of trading capital per trade. The absence of major economic data today means technical levels are likely to hold more reliably.
If you find active trade management challenging, copy trading lets you automatically mirror top gold traders' positions, aligning your portfolio with seasoned professionals while you focus on the bigger picture.
Key Takeaways
- Gold price sits at $4,305.17 in a critical technical juncture between support and resistance.
- The $4,281–$4,285 support zone is today's critical level, with a break signaling deeper correction.
- Moving averages show a mixed but overall bullish structure, with price above the MA50 ($4,272.57) and MA200 ($4,285.42).
- RSI at 51.2 indicates neutral momentum, allowing for movement in either direction.
- Expected daily volatility range is approximately $21.33 based on the ATR(14).
- Upside targets are $4,316.90 (1-hour) and $4,333.89 (4-hour), while downside risk extends to $4,272.57.
Conclusion
The gold price enters the American session at an inflection point, with the $4,286.50 level serving as the immediate line in the sand. While the longer-term bull market remains confirmed by the price position above key moving averages, short-term momentum has turned cautious. Today's session will likely determine whether this is a healthy consolidation before another leg higher or the beginning of a deeper corrective phase.
Traders should prepare for both scenarios, with clearly defined entry levels, stop losses, and profit targets. The convergence of the MA200 with S1 support creates a high-probability reaction zone. A sustained move above the MA20 at $4,298.43 would signal bullish resumption, while failure at support would call for defensive positioning. For those executing these strategies within an Islamic framework, a halal gold trading platform ensures all positions remain riba-free and fully Shariah-compliant.
FAQ
- What is the most important gold price level to watch today?
- The $4,281–$4,285 support zone is critical. A break below $4,278.64 would signal a deeper correction toward $4,272.57 and possibly $4,250.
- Is gold still in a bull market?
- Yes, the primary bull market is confirmed by price trading above the MA200 at $4,285.42. However, the short-term trend is neutral to slightly bearish with price recently testing the MA20 at $4,298.43.
- What's a good entry point for a long position?
- Wait for a confirmed bounce from the $4,281–$4,285 support zone with a 1-hour close above $4,298. Then enter on a retest of $4,298.43, with a stop below $4,278 and initial targets at $4,316.90 and $4,333.89.