
The gold price opened the Asian session at $4,327.26, hovering near the lower end of its recent range after failing to mount a challenge on the psychologically significant $4,500 level last week. That rejection has left the metal in a corrective phase, and this morning's thin liquidity is amplifying the importance of two key pivot levels: $4,348 on the downside and $4,376 to the upside. Traders should expect a slow, grinding session with low volume — chasing moves here risks getting caught in false breakouts.
June 15 brings no high-impact US data, so the direction will be driven purely by technicals and any overnight geopolitical headlines. The immediate bias is bearish below the 20-period moving average, but oversold signals on the hourly chart suggest a bounce could materialise before the next leg lower.
Gold Price Overview: Macro and Session Context
Macro Context
The US Dollar Index (DXY) continues to trade with a firm bid above 102.80, pressuring the gold price as an alternative asset. US Treasury yields remain elevated, with the 10-year note hovering near 4.35%, increasing the opportunity cost of holding non-yielding bullion. The Federal Reserve's cautious stance — reinforced by last week's hawkish minutes — keeps rate cuts off the near-term table, which is a headwind for gold.
Geopolitical tensions, particularly around maritime trade routes, have offered intermittent support. However, the market has largely priced in the current risk premium. Without fresh escalation, the macro backdrop favours a continued correction from the failed $4,500 attempt.
Session Outlook
The Asian session is typically characterised by low liquidity and narrower ranges. Spot gold price is already within 0.6% of its daily support zone — we may see a slow drift lower toward $4,348 before any meaningful buying emerges. The lack of catalysts means price action will respect technical levels more than usual. A break above $4,376 (1-hour resistance) would signal intraday bullish momentum, but the medium-term trend remains bearish until price reclaims the MA20 at $4,369.
Technical Analysis of the Current Gold Price
Moving Average Structure
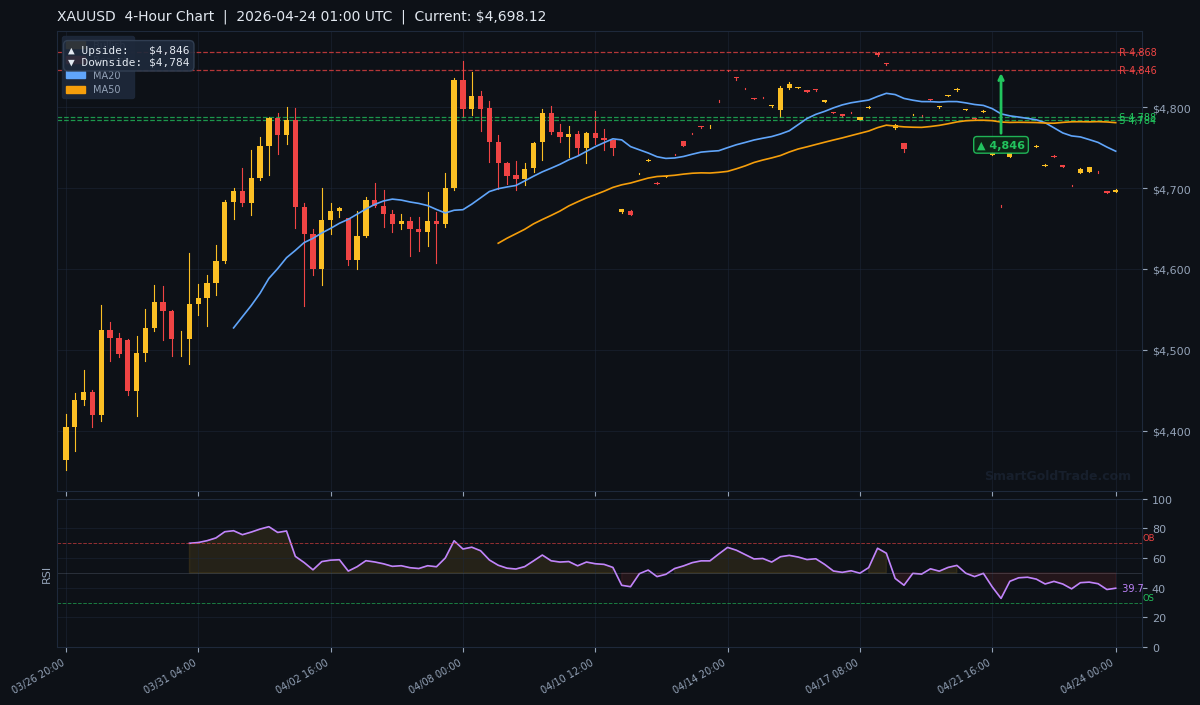
The moving averages paint a clear bearish picture on the 4-hour timeframe. The MA20 sits at $4,369.50, the MA50 at $4,401.80, and the MA200 at $4,377.40. The current gold price of $4,327.26 is below all three, confirming a bearish structure. More importantly, the MA20 is below the MA50, indicating that short-term momentum is negative and that sellers are in control of the near-term trend.
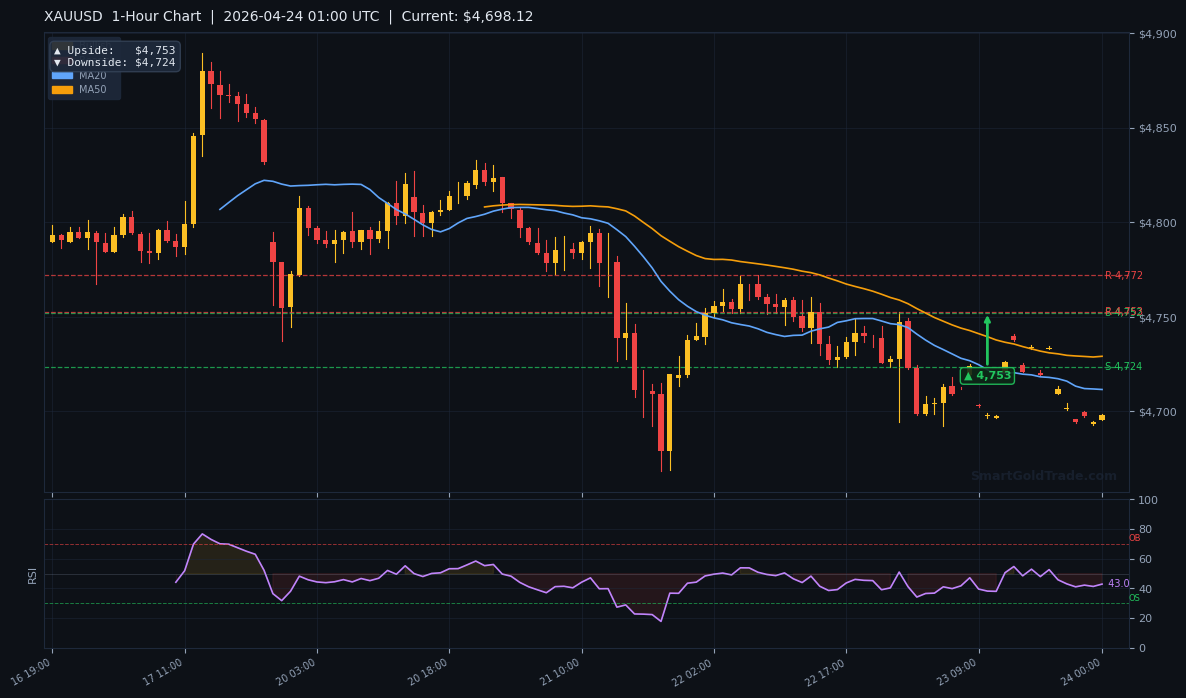
On the hourly chart, the MA20 is acting as dynamic resistance around $4,360, and each attempt to rally has been met with fresh selling. Until the price can close above the MA20 on the 4-hour chart, any bounce should be treated as a retracement within a larger downtrend.
RSI and Momentum
The 14-period RSI on the 4-hour chart stands at 39.7, which is neutral — not yet oversold. This leaves room for additional downside to the 30–35 zone before a significant reversal becomes likely. On the hourly chart, RSI has dipped below 30 twice in the past 24 hours, each time triggering a short-lived bounce that failed to break above $4,370.
This pattern suggests weakening buying momentum and a higher probability of a breakdown through support.
Key Price Levels for Spot Gold
Support levels from the 4-hour chart: S1 at $4,408.30 and S2 at $4,404.10. These levels are actually higher than the current gold price, meaning they are former support that has now become resistance. The current immediate support is the 1-hour downside target of $4,348, followed by the 4-hour downside pivot of $4,404.
Resistance levels: R1 at $4,483.40 and R2 at $4,461.70. The 4-hour upside pivot points to $4,462, while the 1-hour resistance sits at $4,376. The daily pivot chart shows a potential upside target of $4,825 if a sustained rally develops. That scenario seems remote this session.
The ATR(14) is $19.50, implying an expected daily range of roughly $19.50 from current levels. In thin Asian trade, the actual range may be narrower, so trades should be sized accordingly.
Fundamental Drivers
The main story from the past week is gold’s inability to push toward $4,500. Despite strong buying during the previous rally, sellers emerged decisively near $4,480 and have driven the gold price back below the moving averages. The catalyst appears to be a combination of a stronger US dollar and profit-taking by large speculators.
COT data from last Friday showed a reduction in net long positions for the first time in three weeks. The correlation with the DXY remains strong — for every 0.5% move in the dollar, gold moves roughly 0.4% in the opposite direction. With the dollar index holding above 102.80, the path of least resistance for gold is lower.
Key Event to Watch
This week’s main focus will be the US GDP advance estimate on June 20, but that is too far away to influence today’s action. In the meantime, any unexpected escalation in trade tensions or geopolitical conflict could provide a short-lived bid for gold. However, without such a catalyst, the technicals will dominate.
Devil's Advocate
The main bearish bias could be invalidated if gold manages to reclaim the $4,376 level (1-hour resistance) and hold above it for three consecutive hourly closes. That would signal that the sellers are losing control and that a retest of the $4,462 area is possible.
Additionally, if the DXY suddenly weakens due to a surprise dovish comment from a Fed official, the gold price could rally quickly given the short positioning in the market. The level to watch is $4,404 — if price breaks and holds above that old support-turned-resistance, the short-term trend would shift neutral. Conversely, a break below $4,348 would open the door to $4,313.
Trading Strategy for Asian Session
Given the bearish structure and thin liquidity, the most prudent approach is a short-side setup with a tight stop. Traders can look for a bounce toward $4,360–$4,376 (the 1-hour resistance zone) to enter short positions. The stop loss should be placed above $4,390 (approximately 0.5 ATR above resistance). The initial take-profit target is $4,348 (1-hour downside pivot), and if that breaks, the next target is $4,330.
Alternatively, a break below $4,348 with strong volume (visible on the 15-minute chart) can be traded as a breakout short targeting $4,313 (the March swing low). Conservative traders should wait for the New York session when liquidity improves.
For those preferring a contrarian long, the entry zone is $4,340–$4,348 with a stop below $4,320 and targets at $4,376 then $4,404. However, this is a higher-risk setup given the bearish moving average alignment. Traders who’d rather not manage intraday positions manually can follow top gold traders through automated copy trading, which mirrors professional strategies in real time.
Key Takeaways
- The gold price is currently $4,327.26, below all major moving averages (MA20, MA50, MA200).
- The 4-hour RSI at 39.7 is neutral, leaving room for further downside before oversold levels.
- Immediate resistance is $4,376 (1-hour) and $4,462 (4-hour pivot).
- Key support levels: $4,348 (1-hour downside) and $4,404 (4-hour downside).
- The ATR of $19.50 suggests a daily range of about $19—expect tight moves in the Asian session.
- A break below $4,348 would shift the bias to aggressively bearish with a target near $4,313.
Conclusion
Gold’s failure near $4,500 has reset the medium-term outlook to bearish. The price structure on the 4-hour chart is firmly below the moving averages, and the RSI has room to fall further. For today’s Asian session, expect range-bound trade between $4,348 and $4,376, with the bias tilted toward the downside. Traders should avoid chasing moves in low liquidity and wait for confirmed breakouts or bounces at well-defined levels. The gold price will remain under pressure until the dollar weakens or geopolitical risks escalate significantly — neither of which appears imminent.
FAQ
- Is the gold price still quoted per troy ounce?
- Yes, the international spot gold price is always quoted per troy ounce (31.1035 grams). At $4,327.26 per ounce, that equates to roughly $139 per gram.
- What is the key resistance level for spot gold this session?
- The immediate resistance is $4,376 on the 1-hour chart, followed by the 4-hour pivot at $4,462. A close above $4,376 would suggest short-term strength returning.
- Where should I place a stop loss for a short trade on gold today?
- A stop loss should be placed above the nearest resistance, around $4,390, which is roughly 0.5 ATR above the $4,376 level. Adjust position size for your personal risk tolerance.
For traders interested in an ethical, mark-up free approach to gold trading, halal gold trading offers a Shariah-compliant alternative with physical ownership and no interest. Those seeking automated execution of technical setups can explore professional gold trading signals that provide real-time entry and exit alerts.
Risk Disclaimer: Trading Gold (XAU/USD) carries significant risk of loss and is not suitable for all investors. This content is for informational purposes only and does not constitute financial advice. Always conduct your own research and trade responsibly.