
The gold price is holding at $4,213.53 in the early Asian session, digesting last week's escalation in Middle Eastern tensions. US Treasury Secretary Scott Bessent's statement on Wednesday confirmed the US Navy's continued blockade of Iranian ports, a geopolitical risk factor that underpins the metal's long-term safe-haven appeal. With liquidity thin in the Asian window, traders should prepare for a range-bound session that tests nearby support before any attempt at a recovery.
Gold Market Overview
Macro Context
The US Dollar Index (DXY) and Treasury yields have shown muted movement overnight, offering little directional impetus for gold. The primary macro driver remains the persistent geopolitical friction, which typically supports gold as a non-yielding asset during periods of uncertainty. However, the Federal Reserve's current positioning, leaning towards maintaining higher rates for longer to combat inflation, continues to cap significant rallies by supporting the dollar. This creates a complex environment where gold is caught between a flight-to-safety bid and a strong dollar headwind.
Traders are also assessing the impact of last week's economic data, which generally reinforced the narrative of a resilient US economy. This has tempered expectations for imminent rate cuts, keeping a lid on gold's upside potential for now. The market's focus is gradually shifting towards any new developments in the Middle East and upcoming US economic indicators later in the week.
Session Outlook
The Asian trading session is characterised by thin liquidity, which often leads to exaggerated but unsustainable price moves. The expected daily volatility range, derived from the ATR(14) of $20.00, suggests a potential session range between $4,193 and $4,234. Without major scheduled news from the Asia-Pacific region, price action is likely to be technical and reactive to any unexpected headlines regarding the Middle East situation. The key for traders is patience; avoid chasing moves in this low-volume environment and wait for price to approach defined support or resistance levels.
Technical Analysis
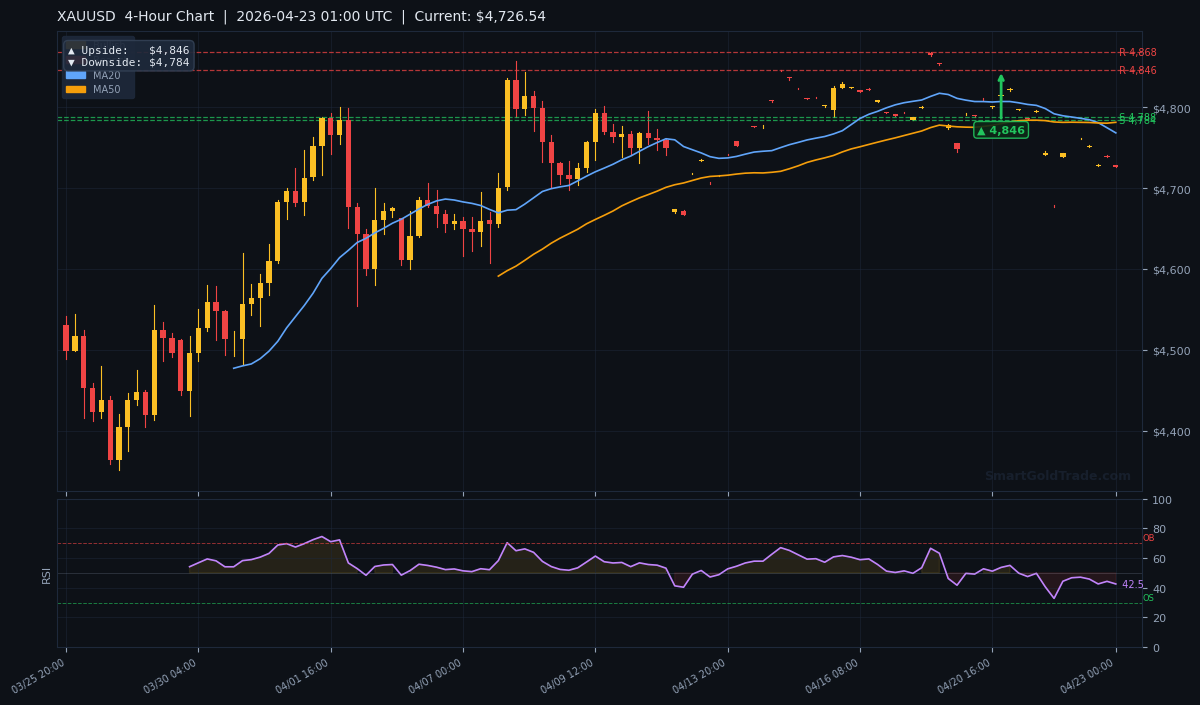
The technical picture for XAUUSD on the 4-hour chart shows the metal under bearish pressure but finding temporary footing. The current price of $4,213.53 is trading below all key moving averages, indicating a lack of bullish momentum in the short to medium term.
Moving Average Structure
The MA20 is at $4,232.00, the MA50 at $4,258.00, and the MA200 at $4,280.00. The fact that the price is below the MA200 places it in bear territory for the longer-term trend. Furthermore, the structure where the MA20 is below the MA50 confirms short-term bearish pressure. A sustained move above the MA20 would be the first sign of a potential near-term recovery.
RSI and Momentum
The RSI(14) reading of 42.5 sits in the neutral zone, indicating that gold is neither oversold nor overbought. This suggests there is room for the price to move in either direction before reaching extreme levels. For traders, this neutral momentum reading means that confirmation from price action at key levels is more important than relying on the RSI alone for entry signals.
Key Price Levels
Immediate support levels are $4,190 (S1) and $4,170 (S2). The nearest and most critical resistance sits at $4,240 (R1), with secondary resistance at $4,265 (R2). The ATR(14) of $20.00 defines the expected daily noise; a break beyond this range from the session open would signal a stronger directional move is underway.
| Timeframe | Upside Target | Downside Target |
|---|---|---|
| Daily | $4,310 | $4,100 |
| 4-Hour | $4,260 | $4,180 |
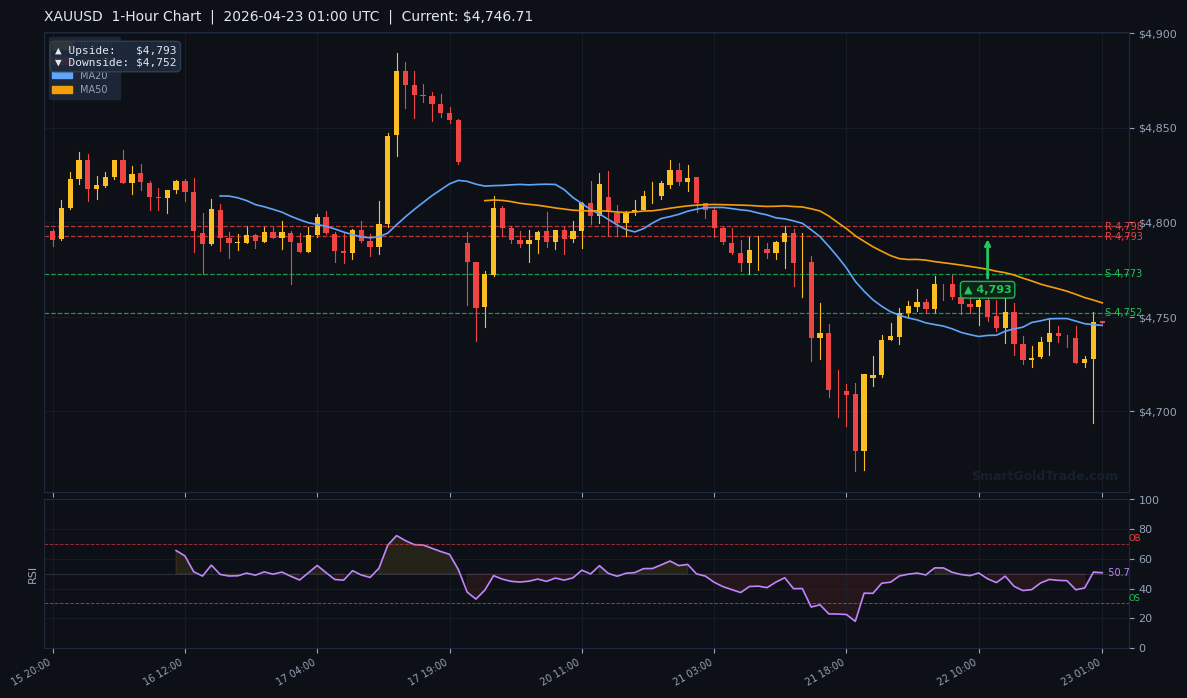
| 1-Hour | $4,235 | $4,195 |
Fundamental Drivers
The dominant fundamental driver remains the geopolitical tension following last week's announcement by US Treasury Secretary Scott Bessent. The US Navy's continued blockade of Iranian ports aims to constrain Iran's revenue, a move that perpetuates instability in the region. Historically, such developments provide a floor for gold prices due to its status as a safe-haven asset. However, the market's reaction has been tempered by the simultaneous strength of the US dollar, which benefits from its own safe-haven flows and higher interest rates.
The correlation between gold and the DXY remains inversely pivotal. Any unexpected softening in the dollar, perhaps from weaker-than-anticipated US data later in the week, could be the catalyst gold needs to break above its immediate technical resistance. For now, the market is in a holding pattern, weighing geopolitical risk against monetary policy expectations.
Key Event to Watch
This week, traders will watch for any official statements or developments regarding the Middle East situation, as these can cause sudden volatility. Additionally, upcoming US GDP and PCE inflation data will be scrutinized for clues on the Fed's next policy move. A significant deviation from expectations in either dataset could override the current technical range and provide the next sustained directional move for the gold price.
Devil's Advocate
The prevailing bearish technical structure could be invalidated if price manages a sustained break above the MA20 at $4,232.00. A move above this level, accompanied by a rise in the RSI above 50, would signal a short-term trend reversal and could trigger a run towards the $4,260 resistance. The fundamental scenario that would flip the trade is a rapid de-escalation in the Middle East, which would remove the key safe-haven bid and likely see gold target the lower support levels around $4,195 and $4,180 with more conviction.
Trading Strategy for Asian Session
Given the thin liquidity and neutral momentum, the optimal strategy is to wait for price to reach key levels before committing. A conservative approach is to look for a bounce from the confluence of supports between $4,190 and $4,170. An entry in this zone, with a stop loss placed just below $4,155 (using the ATR for guidance), targets a move back towards the MA20 at $4,232 and then $4,240. Some traders supplement their own analysis with professional gold trading signals that offer real-time entry and exit alerts, helping to confirm trade setups in uncertain markets.
Alternatively, for a breakout play, a move above the session high with increasing volume could signal a test of $4,235. A stop for such a trade would be placed below the breakout candle's low, and the primary take-profit target would be the 4-hour resistance at $4,260. Risk management is paramount; position sizes should be adjusted for the higher volatility implied by the ATR. For those who prefer a more hands-off approach, copy trading allows you to mirror top-performing gold traders automatically, which can be especially useful when markets are range-bound and demand constant monitoring.
Key Takeaways
- The current gold price is $4,213.53, trading below all key moving averages, indicating bearish pressure.
- Key resistance for the 4-hour chart is at $4,260, while immediate support clusters around $4,190 and $4,170.
- The RSI(14) at 42.5 is neutral, suggesting the next directional move needs confirmation from price action at these S/R levels.
- Geopolitical risk from the US Navy's blockade of Iran provides underlying support, but a strong dollar caps rallies.
- The Asian session's thin liquidity warns against chasing moves; patience for price to reach technical levels is advised.
- A break above the MA20 at $4,232 is needed to shift the short-term bias from bearish to neutral.
Conclusion
The gold price remains in a defensive posture below key moving averages, with the immediate technical focus on the $4,190 to $4,170 support zone. The geopolitical backdrop offers a floor, but the metal requires a catalyst—likely from weaker US data or an escalation in headlines—to mount a meaningful recovery towards $4,260. For the Asian session, range-bound action is the most probable outcome. Traders should use this time to plan entries around the identified levels rather than forcing trades in the quiet market. For Shariah-compliant trading with no interest or leverage, our halal gold trading platform provides a riba-free environment that aligns with Islamic finance principles.
Frequently Asked Questions
- What is the main resistance level for gold right now?
- The most immediate and significant resistance level on the 4-hour chart is $4,260. A daily close above this level would open the path towards $4,310 and higher.
- Where is strong support for XAUUSD?
- A strong support confluence exists between $4,190 and $4,170. This area is defined by previous swing lows and the downside target from the 1-hour chart.
- Is gold in a bear market?
- With the price trading below the long-term MA200 at $4,280, gold is technically in bear territory for the longer-term trend. However, the neutral RSI suggests the current move lacks strong momentum.
- How does the US Navy blockade affect gold?
- Geopolitical tensions, like a naval blockade, increase uncertainty and typically boost demand for safe-haven assets like gold. This provides underlying support, preventing more severe declines.
Trading Gold (XAU/USD) carries significant risk of loss and is not suitable for all investors. This content is for informational purposes only and does not constitute financial advice. Always conduct your own research and trade responsibly.