Gold price (XAU/USD) is hovering at $4,038.58 during Tuesday’s American session, paring earlier gains and struggling to sustain a rebound after June’s crushing sell-off. The precious metal had attempted a modest bounce from the $4,000 support area but now faces renewed selling pressure as the US Dollar holds firm.
The brutal June rout—which saw gold hemorrhage over 11% from $4,500 to near $4,000—was driven by hawkish Fed rhetoric and sticky inflation, and the macro backdrop hasn’t changed significantly. Traders are now squaring positions ahead of this week’s Non-Farm Payrolls report, leaving the short-term focus on whether the $4,000 floor can hold or if sellers are preparing another leg down.
Gold Price and Market Overview
Macro Context
The US Dollar Index (DXY) remains parked near multi-month highs, keeping a lid on any gold euphoria. June’s 11% swan dive was a direct reflection of a Fed that refuses to blink—rate-cut expectations have been pushed further into 2027, and real yields on the long end are finding a floor. While the dollar has paused its ascent this morning, the macro backdrop has not materially changed. Gold price rallies are still being sold unless a fresh catalyst emerges to weaken the greenback.
Geopolitically, the landscape is simmering but not boiling over. Energy markets are calm, and safe-haven demand is largely absent. That leaves gold at the mercy of rate differentials and flow dynamics, both of which still favor the dollar in the near term.
Session Outlook
The American session is poised for two-way action. With the NY opening bell, traders are digesting a light economic calendar, which means post-month-end position adjustments and pre-NFP hedging will dominate price action. The ATR(14) reading of $23.84 suggests a typical daily range just under a half percent, setting the stage for a probable grind between $4,013 and $4,065. A break above or below these boundaries would require a headline-driven impulse—something that is unlikely before Thursday’s jobs data.
Gold Price Technical Analysis
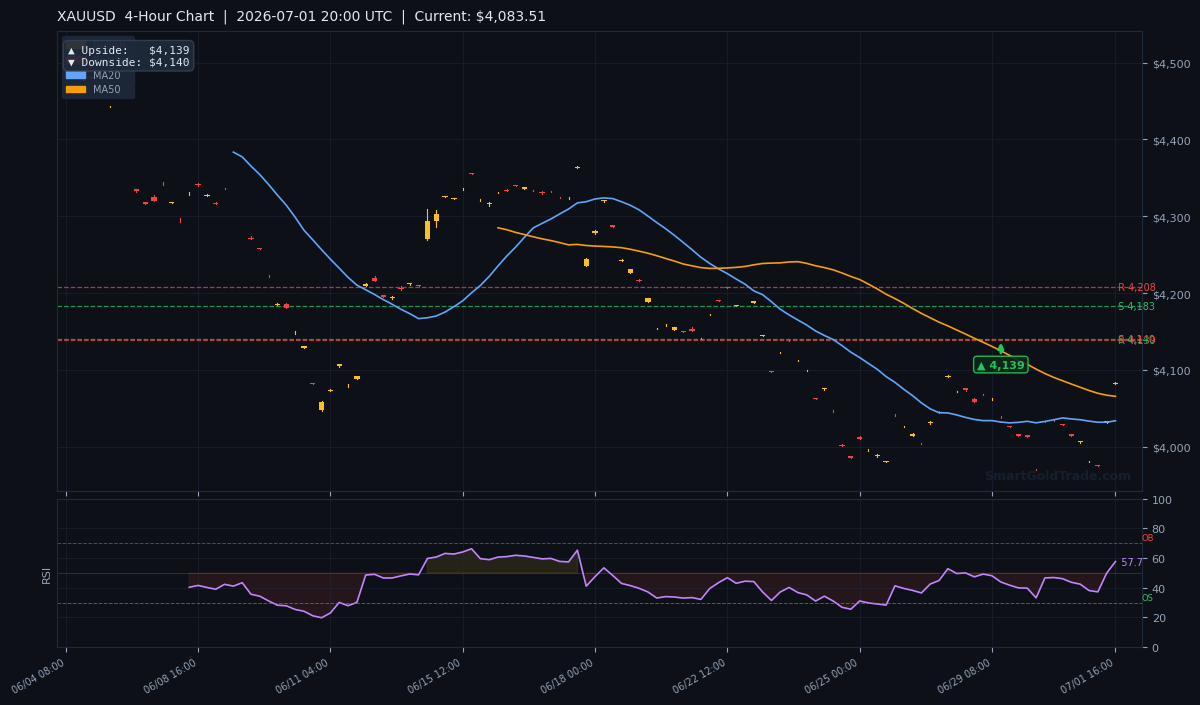
Gold’s chart is painting a mixed picture. The near-term bounce has already lost momentum, leaving price trapped between key moving averages. Here’s how the numbers stack up on the H4 timeframe.
Moving Average Structure
The 20-period MA sits at $4,033.83, while the 50-period MA is at $4,065.63. Gold at $4,038.58 is perched just above the 20-MA but below the 50-MA—a fragile short-term setup that gives neither bulls nor bears full control.
What tilts the scales to the downside is the 200-period MA looming far above at $4,318.48. Trading well below the 200-MA confirms gold remains in structurally bearish territory on the higher timeframe. Moreover, the EMA alignment remains negative: MA20 is below MA50, signaling that underlying momentum still favors the downside even as price tries to stabilize.
RSI and Momentum
The 14-period RSI reads 57.7, right in the heart of neutral territory. There is no overbought or oversold extreme to lean on, which means the indicator gives traders a green light to follow the directional bias they see elsewhere. In this case, the neutral RSI combined with the mixed moving-average picture translates to low conviction—traders should wait for a clear break of either support or resistance.
Key Price Levels
Near-term support is anchored by the 20-MA at $4,033, with the next floor at the 1-hour target of $4,013. A daily close below that would set up a retest of the psychological $4,000 handle. On the upside, immediate resistance is the 50-MA at $4,065, followed by the critical $4,139–$4,140 pivot zone—a make-or-break cluster that repeatedly capped price in recent sessions. A clear break above $4,139 would bring the $4,182 resistance into play.
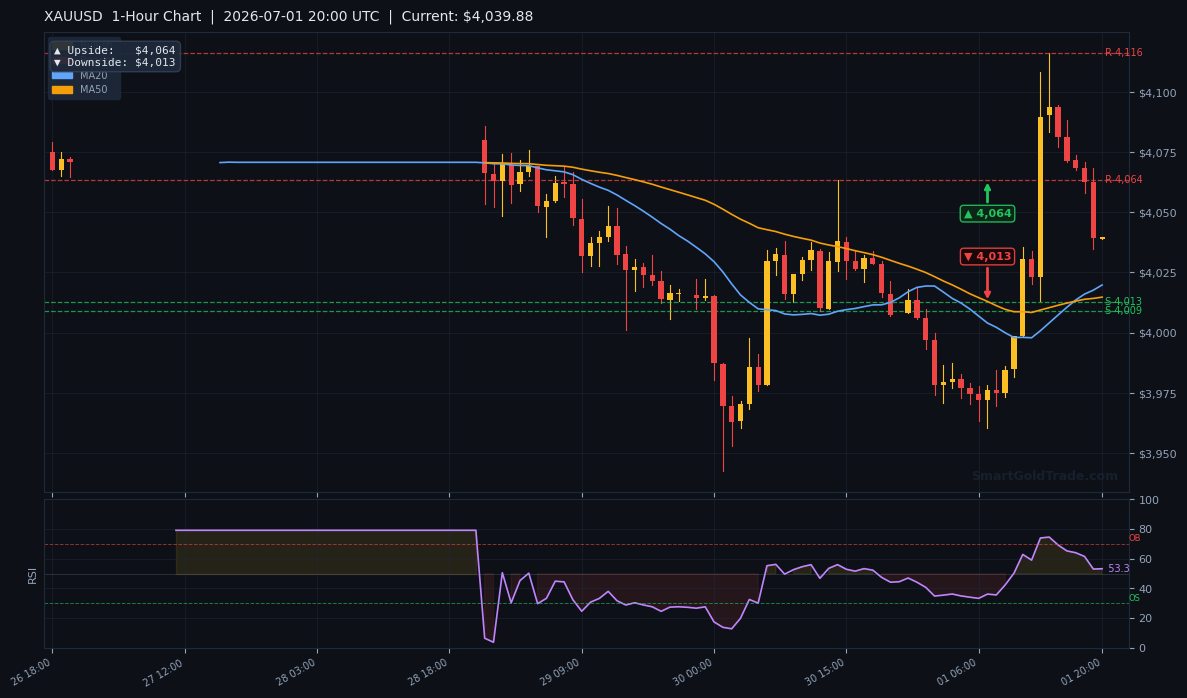
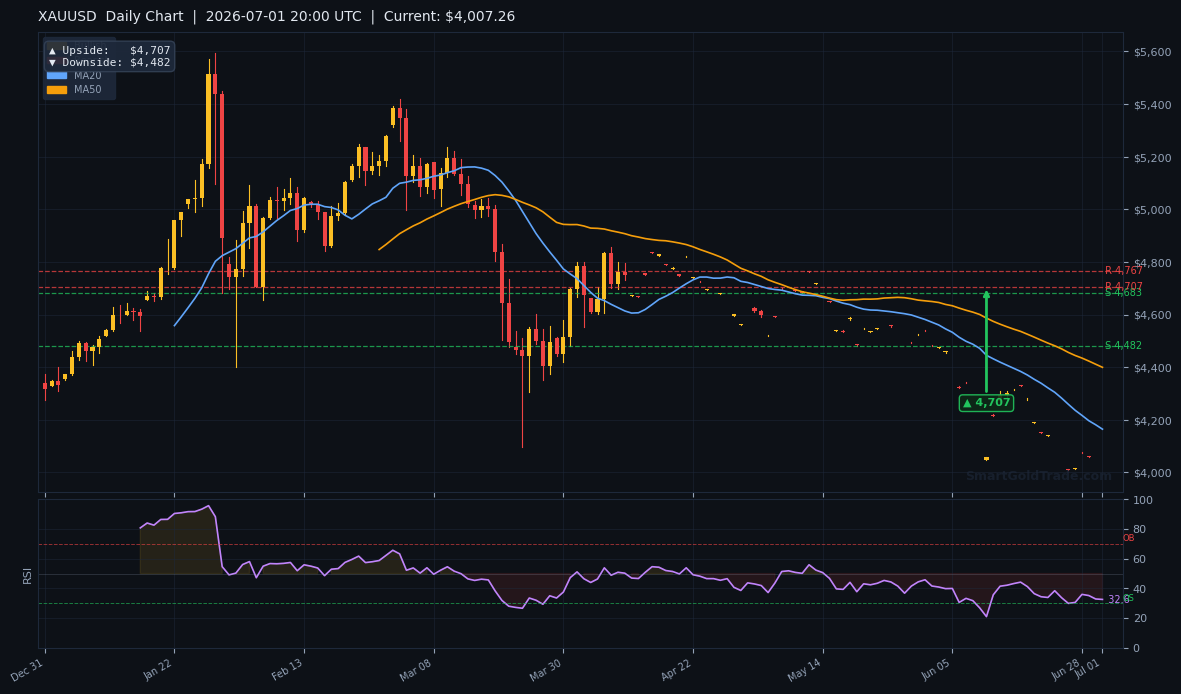
The 1-hour chart provides a finer lens. The initial upside target from the pivot arrows sits at $4,064, while the downside objective is $4,013. For the 4-hour view, the arrow targets point to $4,139 on the upside and $4,140 on the downside—a narrow congestion zone that reinforces the significance of the level. On the daily chart, a sustained breakout could push price to $4,707, while the downside risk extends to $4,482, though these are larger swing targets unlikely to be tested today.
| Timeframe | Upside Target | Downside Target |
|---|---|---|
| Daily | $4,707 | $4,482 |
| 4-Hour | $4,139 | $4,140 |
| 1-Hour | $4,064 | $4,013 |
Fundamental Drivers
The story of the past 30 days is an unflinching US dollar. June’s 11% gold price rout from $4,500 to $4,000 coincided with a DXY that sliced through resistance after the Fed’s June meeting signaled a longer pause. The market has since priced out any dovish pivot this year, and hawkish talk continues to drip into the wires. Tuesday’s stall near the 20-MA is more of a technical respite than a fundamental shift.
The second driver is Treasury yields. While the source material highlights the dollar, the 10-year note found a bid near 4.50% last month, creating a stiff headwind for non-yielding gold. Any hawkish surprise in the upcoming jobs data could reignite the yield rally and snap gold price back toward the $4,000 handle.
Key Event to Watch
All eyes are now locked on Thursday’s June Non-Farm Payrolls report. A headline print above 250K would likely reinforce the dollar’s dominance and send gold price tumbling below the $4,013 floor, paving the way to $4,000. Conversely, a weak number could light the fuse for a short-squeeze rally that challenges the $4,139–$4,182 resistance cluster. Until then, expect choppy, range-bound trading driven by position squaring.
Devil’s Advocate
The bullish bounce rests on shaky ground. The EMA structure (MA20 below MA50) and gold’s distant position below the 200-day MA warn that the primary trend remains down. If the dollar index catches even a small bid—perhaps on a hotter-than-expected ADP report or hawkish FOMC minutes—buyers could evaporate quickly.
The level that would kill the long thesis is a break below $4,033 (the 20-period MA). A daily close under that threshold would flip the short-term bias bearish and open the door to a retest of $4,013. In that scenario, the modest recovery becomes nothing more than a dead-cat bounce.
Trading Strategy for American Session
Given the neutral RSI and the tug-of-war between short-term stabilization and medium-term bearish structure, patience is key. Aggressive traders can look for an entry zone between $4,013 and $4,033 to play a bounce toward the 50-MA at $4,065, with a stop below $4,000. This yields roughly a 1:2 risk-to-reward profile.
For those who prefer to avoid riba and leverage, executing such a setup on a halal gold trading platform ensures every trade is spot-based and Shariah-compliant. Meanwhile, integrating professional gold trading signals can help confirm entry and exit points in real time, especially during the tight pre-NFP range.
A break above $4,065 would open the door to $4,139, while a firm break below $4,033 invites sellers to target $4,013. As always, keep position sizes aligned with the $23.84 ATR range so that volatility doesn’t stop you out prematurely.
Key Takeaways
- Gold price trades at $4,038.58 in the American session, losing steam after June’s 11% collapse.
- Price holds just above the 20-MA ($4,033) but below the 50-MA ($4,066), while the 200-MA at $4,318 remains the long-term bearish anchor.
- RSI(14) at 57.7 signals neutral momentum—no overbought or oversold extremes.
- Immediate support sits at $4,033 and $4,013; first resistance is the 50-MA at $4,065, followed by the $4,139–$4,140 zone.
- The ATR of $23.84 suggests a likely session band between $4,013 and $4,065.
- The upcoming NFP report on Thursday is the major catalyst—a strong jobs print could send gold back to $4,000 or lower.
Conclusion
Gold price is struggling to build a sustainable recovery after an unforgiving June, and the bounce is far from a trend change. With the MA20/MA50 alignment still bearish and the 200-day MA towering above, the burden of proof remains with the bulls. The $4,033 pivot will be the line in the sand during the American session—holding above it keeps the $4,065 target alive. A slip below, however, would signal that the June bleeding isn’t over. With NFP days away, this is a market waiting for a spark. Patience and strict risk control are the order of the day.
FAQ
- Where is gold price headed in the American session?
- The most probable scenario is a range-bound tussle between $4,013 and $4,065, with a slight upward bias only if price closes above the 20-MA at $4,033. A clean break above $4,065 would open a path to $4,139.
- What will the NFP report do to gold?
- A strong Non-Farm Payrolls number—above 250K—will likely send gold price below $4,013, targeting $4,000 or even the 1-hour downside objective at $4,013. A weak print could spark a rally past $4,139 toward the $4,207 daily resistance.
- Is it safe to buy gold now?
- Buying near $4,013–$4,033 offers a reasonable risk-reward for a bounce, but keep stops tight and position size small until the NFP-driven trend clarifies. Waiting for a confirmed break above $4,065 can reduce downside exposure in this volatile environment.