The gold price slipped below the $4,030 threshold during Tuesday’s American session, trading at $4,028.76 as the market digests Monday’s steadying US Treasury yields and a new flare-up of Middle East tensions. Instead of triggering a safe-haven bid, the news flow merely halted the dollar’s slide — leaving gold pinned below several layers of technical resistance. With money markets still pricing 34 basis points of Federal Reserve tightening for 2026, the yellow metal is struggling to attract committed buyers. The session’s early price action suggests sellers are testing conviction ahead of Friday’s Non-Farm Payrolls report, and $4,000 is emerging as the next psychological magnet. This gold price dynamic keeps short-term momentum tilted firmly to the downside.
Gold Price Market Overview
Macro Context
The US Dollar Index is holding steady near 103.5 while the 10-year Treasury yield oscillates around 4.48% — a level that has not provided any relief for non-yielding assets. On Monday, the North American session saw yields stabilise after a brief dip, largely because crude oil prices found a floor on escalating geopolitical risk in the Middle East. That dynamic kept the dollar bid and reinforced the rate differential that has plagued gold. Fed funds futures continue to pencil in at least 34 bps of tightening this year, a hawkish anchor that limits upside for the metal. The gold price is therefore caught between a firm dollar and rising real yields, with no immediate catalyst to reverse the drift.
Session Outlook
The American session tends to produce the day’s most decisive moves, and today the bias remains tilted to the downside. Liquidity is adequate but not euphoric — traders are hesitant to add fresh longs ahead of the month-end fixing and the looming NFP print. Expect gold to carve a range between $4,000 and $4,050, with a break in either direction likely to attract momentum-driven flow. If yields edge higher during New York hours, the $4,000 handle will face immediate pressure. A sustained gold price recovery above $4,050 looks unlikely without a surprisingly dovish Fed signal.
Gold Price Technical Analysis
Moving Average Structure
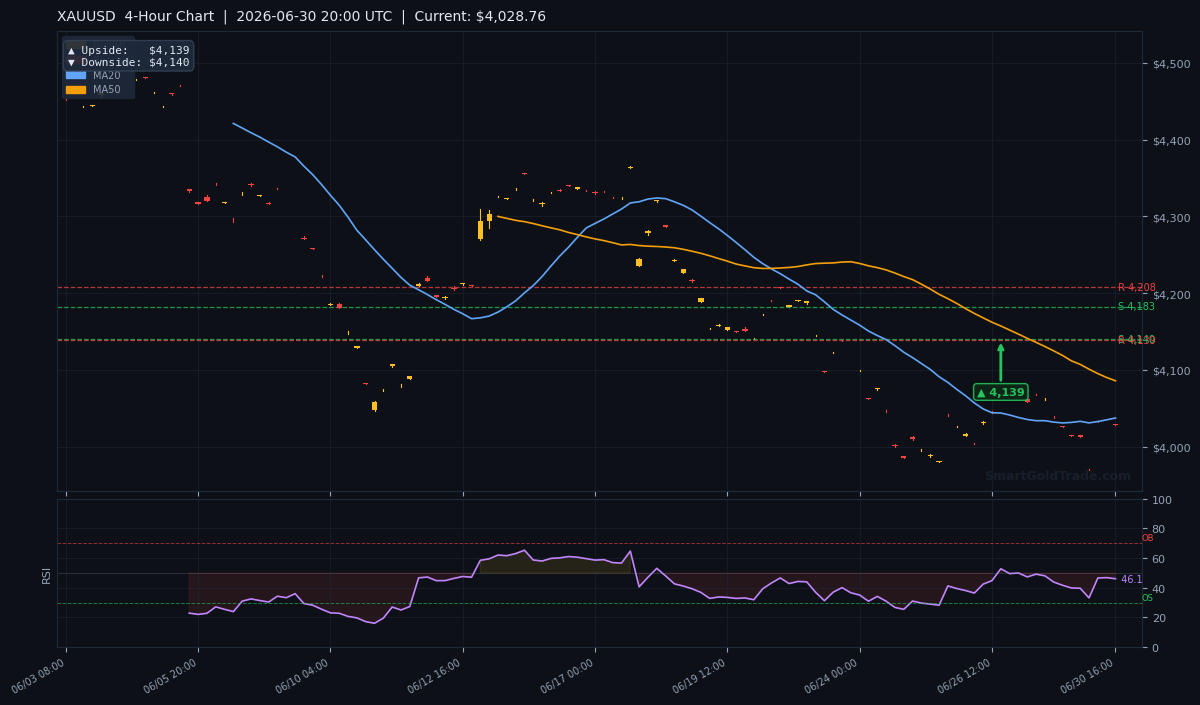
The moving averages paint a sobering picture. The MA20 sits at $4,037.50, and price is trading below it — a clear short-term bearish signal. The MA50 rests at $4,085.93, meaning the mid-term trend is also pointed lower. The MA200 at $4,334.29 confirms that the long-term backdrop has shifted into bear territory. With MA20 residing beneath MA50, the EMA structure reinforces a descending staircase that invites sellers on rallies. This technical picture signals that any short-lived gold price bounce will likely meet sellers right around the MA20.
RSI and Momentum
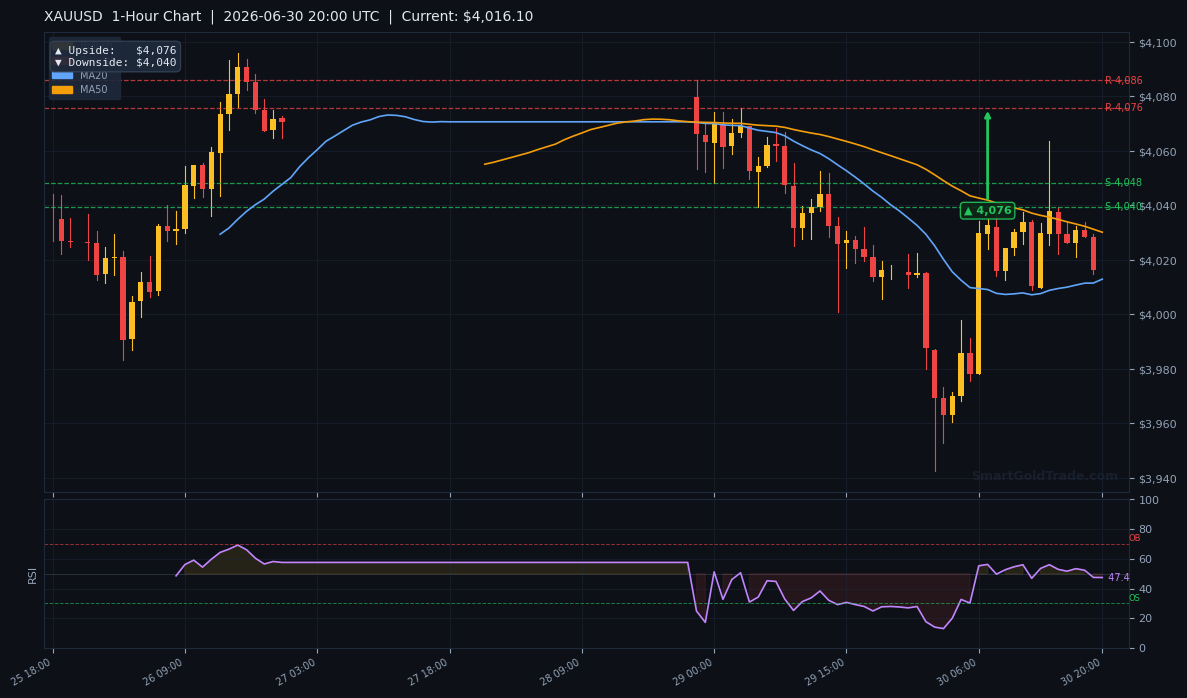
The 14-period RSI reads 46.1 — neutral by textbook definition, but slipping towards the bearish half of the range. There is no oversold reading to fade, which means the sell-off still has room to run. Momentum oscillators on the four-hour chart show declining histogram bars, supporting the view that intraday bounces will likely be sold. For gold price traders, the absence of an oversold reading suggests chasing short positions still makes sense as long as the RSI stays below 50.
Key Price Levels
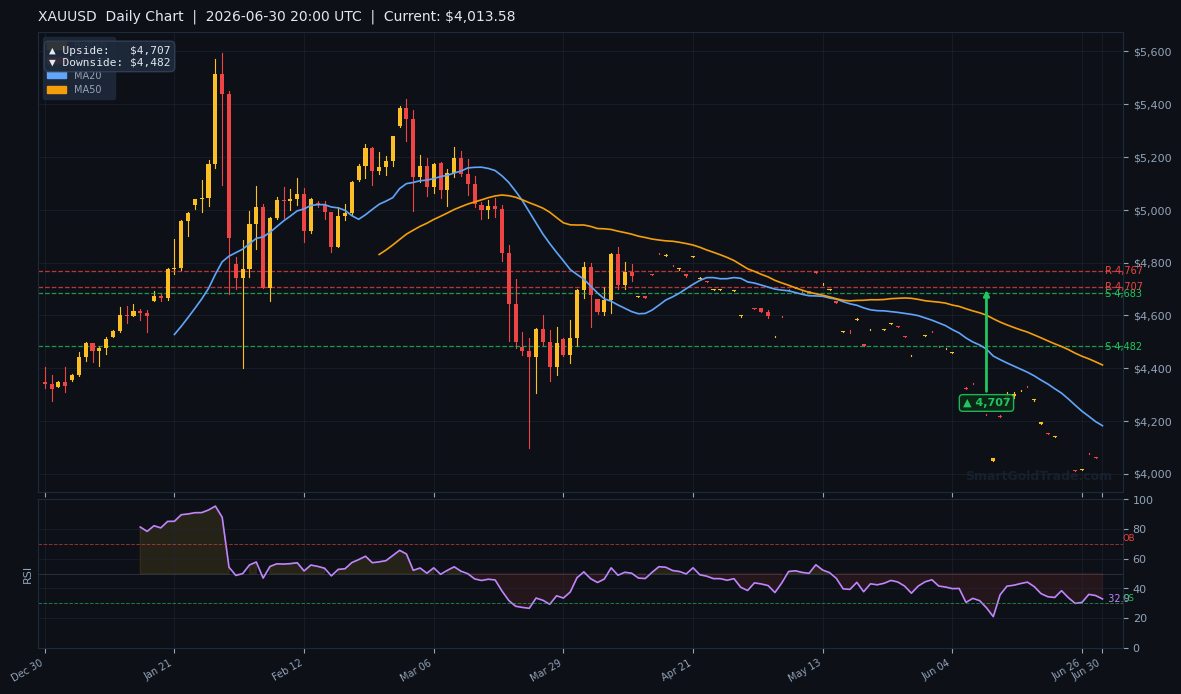
Despite the current spot price near $4,028, the structural support-turned-resistance levels loom higher. S1 stands at $4,234.79 and S2 at $4,182.58 — both will now act as formidable ceilings if price attempts a recovery. On the upside, R1 and R2 are even farther away at $4,365.61 and $4,321.65. The ATR(14) of $19.52 suggests a typical daily range of about $39, meaning the session’s moves will likely stay within a $40 envelope unless a news catalyst appears. While the gold price oscillates near $4,028, the distance to the next resistance cluster shows how much declining momentum has built.
| Timeframe | Upside Pivot | Downside Pivot |
|---|---|---|
| Daily | $4,707 | $4,482 |
| 4-Hour | $4,139 | $4,140 |
| 1-Hour | $4,076 | $4,040 |
Fundamental Drivers of the Gold Price
Monday’s steadiness in Treasury yields removed a key bullish catalyst. The bond market’s pause, combined with crude oil’s recovery on Middle East supply fears, supported the dollar — a headwind for gold. Even the geopolitical heat in the region, which would normally send bullion higher, was offset by the persistent expectation that the Fed will tighten policy by 34 bps in 2026. That expectation anchors real yields and keeps gold bulls on the defensive. For traders who prefer to execute swings without swap interest, a halal gold trading account eliminates overnight fees while trading spot metal in gram lots.
Real Yields and the Dollar
Real yields, which adjust for inflation, have been climbing as Fed tightening expectations firm. Since gold yields nothing, a higher real yield environment reduces the appeal of holding bullion. This gold price squeeze is likely to continue unless bond markets start pricing in rate cuts. Meanwhile, the dollar’s stability near 103.5 adds an extra layer of resistance for any bullish reversal in the precious metal.
Key Event to Watch
The Non-Farm Payrolls report on Friday July 3 is the week’s monster risk event. A print above 190,000 jobs would reinforce the hawkish narrative and could accelerate gold’s slide through $4,000. Conversely, a disappointing number might give the metal a short-squeeze lift toward the $4,076 one-hour pivot. The gold price direction this week hinges almost entirely on that release, so position sizing must be defensive until the data lands.
Devil’s Advocate
A sudden escalation in the Middle East that disrupts oil supply chains could flip the dollar-gold correlation, but that scenario is impossible to time. More realistically, a daily close back above the MA20 at $4,037.50 and a break of the one-hour upside pivot at $4,076 would invalidate the immediate bearish thesis. If price reclaims that zone with conviction, short sellers would need to cover quickly and look for a retest of $4,139.
Trading Strategy for American Session
The path of least resistance is lower. I’m watching for a shallow bounce into the $4,035 – $4,045 supply zone, which aligns with the MA20 and offers a sensible entry for short positions. A stop-loss above $4,070 — just beyond the one-hour upside pivot — would limit risk to roughly $25 – $35, well within the ATR-implied daily range.
Take-profit targets are staggered: first at $4,000, then at $3,983, which matches the recent Asian session low. For those who prefer guided entry points, professional gold trading signals can deliver real-time trade ideas with exact stop-loss and take-profit levels. If price instead reclaims $4,050 on strong volume, the short bias weakens and a wait-and-see approach is smarter.
Key Takeaways
- Gold price is trading at $4,028.76, below the MA20 at $4,037.50, confirming short-term bearish control.
- The RSI at 46.1 leaves room for further downside without hitting oversold extremes.
- Immediate support sits at $4,000, followed by the $3,983 level that marked the recent low.
- Resistance above is stacked: $4,076 (1H pivot), $4,139 (4H pivot), and the structural S1 at $4,234.79.
- ATR of $19.52 suggests a session range of approximately $40, making $4,000 – $4,040 the key battleground.
- Friday’s NFP will be the decisive catalyst — a strong print could break $4,000, while a weak one may lift gold toward $4,076.
Conclusion
The American session opens with gold still searching for a floor. Yields have steadied, the dollar is holding firm, and the technical structure screams caution for bulls. Until the market sees evidence that the Fed’s 34 bps of tightening is mispriced — or until geopolitical risk actually drives a flight into bullion — rallies remain selling opportunities. The $4,000 zone is the line in the sand, and a break lower would open the door to $3,983 and potentially deeper levels. Even if you are not yet confident in your own chart reading, copy trading allows you to mirror experienced gold traders who navigate these setups daily. For now, let the trend be your friend and don’t fight the downward drift. Any sustained gold price recovery will need a clear break above the MA20 to shift sentiment.
Gold Price Frequently Asked Questions
- Why is gold price falling despite Middle East tensions?
- The geopolitical risk is boosting crude oil and keeping the dollar supported, which in turn weighs on gold. Moreover, steady Treasury yields and hawkish Fed expectations are dominating haven flows, leaving little room for gold to rally.
- What is the next major support for gold price?
- The immediate support is the psychological $4,000 handle. A break below that would expose the $3,983 level, which was tested during the recent Asian session, and potentially the $3,950 area.
- How will Friday's NFP report affect gold price?
- A jobs number above 190,000 would likely strengthen the dollar and push gold below $4,000. A weaker reading could trigger a relief rally toward the one-hour pivot at $4,076 or even the four-hour pivot at $4,139.
- What is the best trading strategy for gold today?
- A short-on-rally approach between $4,035 and $4,045 with a stop above $4,070 offers a risk-defined entry. First take-profit at $4,000, second at $3,983. Aggressive longs only make sense if price reclaims and holds above $4,050.
- What factors could push gold price back above $4,100?
- A sharp dov