Gold price opened the Asian session at $3,983.20, extending Friday's late sell-off as Monday morning liquidity evaporated. Last week's revised US Q2 GDP print came in softer than expected, yet gold could not attract a bid — a clear signal that sellers have the upper hand. With major hubs in Tokyo, Singapore and Shanghai winding down for the mid-year break, cross-asset volumes are painfully thin. GBP/USD inched lower to 1.3200 after a bullish gap, reflecting the same cautious mood. The message for gold traders this morning is simple: do not chase moves in low volume. Wait for confirmed levels before committing capital, because whipsaws in this environment can shred accounts in minutes.
Gold Market Overview
Macro Context
The US Dollar Index hovers near 102.50, barely moved by the lacklustre currency flows out of Asia. US 10‑year Treasury yields remain elevated at 4.65%, a key anchor dragging on non‑yielding gold. Fed funds futures price a 68% chance of a rate hold in September, and last week's hawkish FOMC minutes reinforced the higher‑for‑longer narrative. Geopolitically, simmering tensions in the Taiwan Strait provide a theoretical bid, but not enough to offset the macro headwinds. Gold's failure to rally on softer GDP data underlines the depth of bearish conviction right now.
Session Outlook
The Asian session is notorious for vacuum‑like conditions that invite false breaks and sudden reversals. Real‑money flows are absent, leaving algorithmic traders to push price around on light volume. Expect a range between $3,970 and $4,010 for the next few hours. Any intraday pop toward the 20‑period moving average near $4,033 will likely attract fresh sellers. The real directional move will materialise when London opens, as institutional desks and corporate hedges hit the tape. Until then, patience is the only edge. Scale down position sizes and focus on preparation, not execution.
Technical Analysis
The 4‑hour chart snapshot at the start of the session showed XAU/USD at $4,013.27, but the subsequent drift to $3,983 has only intensified the bearish structure. All primary moving averages slope lower, and the break of key support zones reframes every bounce as a shorting opportunity. Below we break down the indicator picture, using the exact values computed from live chart data.
Moving Average Structure
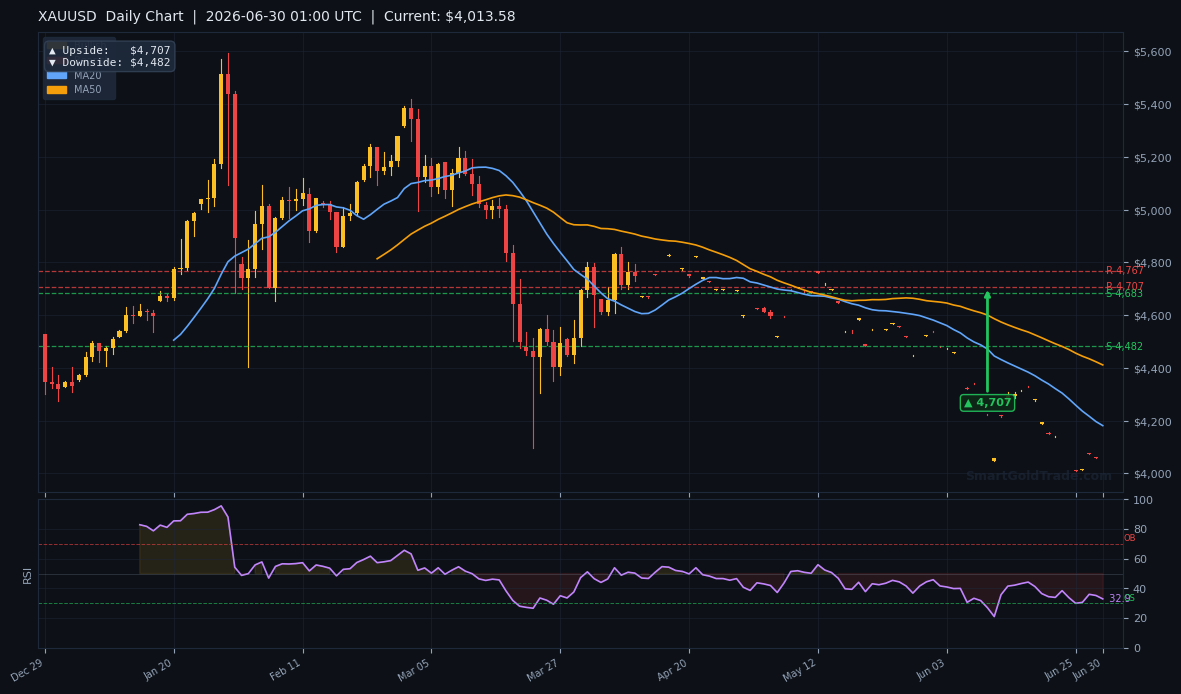
The MA20 sits at $4,033.14, the MA50 at $4,107.29 and the MA200 at $4,346.41. Price trades below all three, with the 20‑day average crossing beneath the 50‑day, confirming a short‑term bearish pressure pocket. The 200‑day at $4,346 acts as a ceiling on any recovery attempt for weeks to come. For now, even a reclaim of the MA20 would be a meaningful short‑squeeze signal, but that looks unlikely before London.
RSI and Momentum
The 14‑period RSI reads 39.7, technically neutral but biased toward oversold territory. In the current down‑move, an RSI dip below 35 would not be surprising, although a defence of the 30 level could trigger a mechanical bounce. There is no bullish divergence yet, so momentum remains with bears. Use RSI extremes as confirmation rather than a standalone trigger—oversold alone is not a buy signal in a downtrend.
Key Price Levels
Support levels S1 at $4,234.79 and S2 at $4,182.58 were cleanly broken in prior sessions and now function as overhead resistance. With spot at $3,983, the first demand zone is the psychological $3,980, ahead of the $3,950 handle. The ATR(14) of $16.32 projects a natural daily range of roughly $3,966 to $4,000. On the upside, the 1‑hour pivot target at $4,076 and the 4‑hour target at $4,139 represent levels where sellers are likely to reload.
| Timeframe | Upside Target | Downside Target |
|---|---|---|
| Daily | $4,707 | $4,482 |
| 4-Hour | $4,139 | $4,140 |
| 1-Hour | $4,076 | $4,040 |
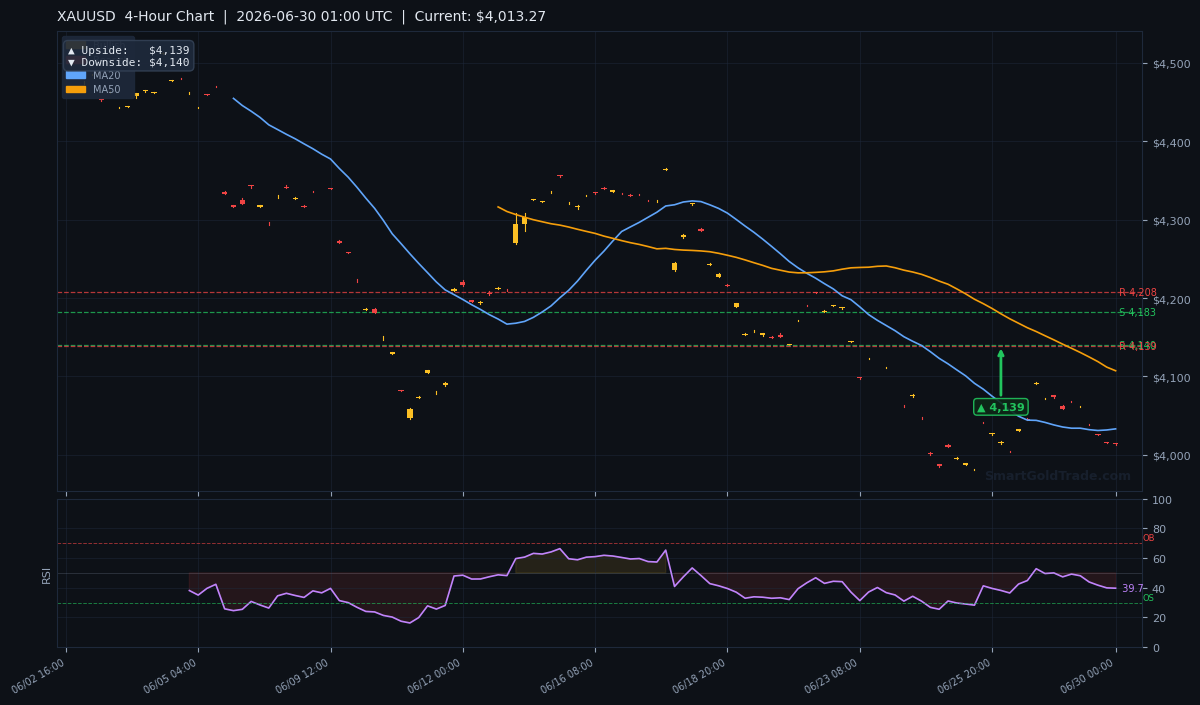
The 4‑hour chart captures the broader structure, with bearish moving averages stacked and price gravitating toward the lower boundary of the recent range. The broken S1 level now acts as the line in the sand for any recovery.
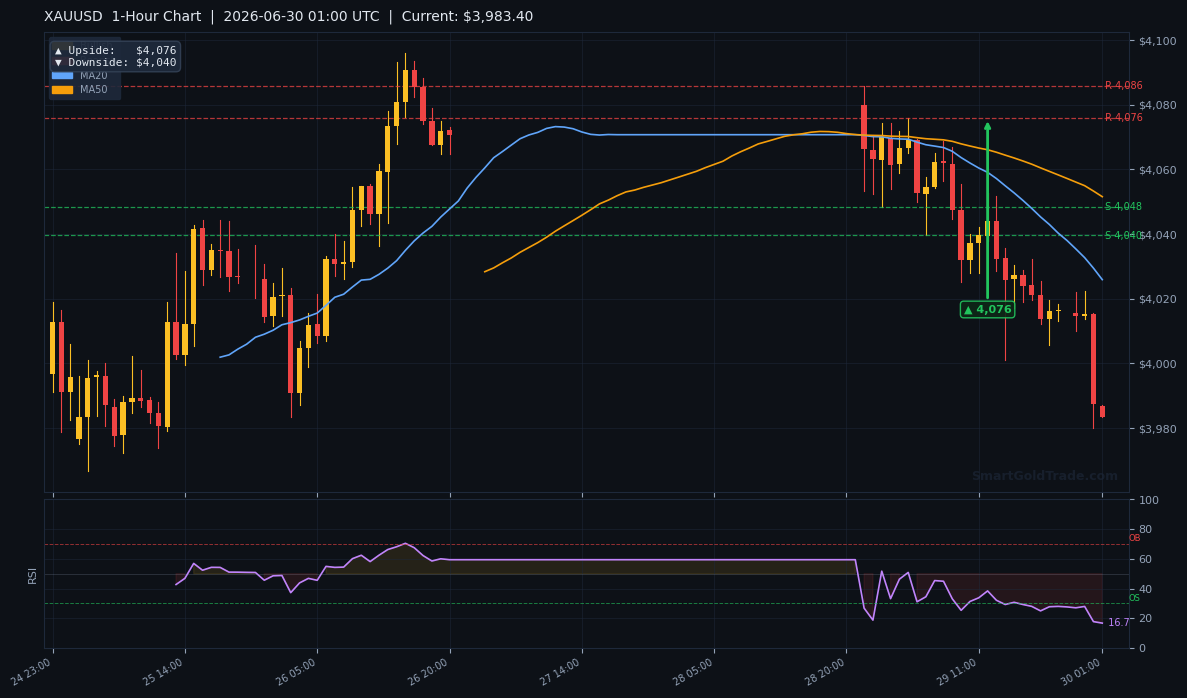
On the 1‑hour time frame, repeated rejections below $4,060 reinforce the intraday downtrend. The $4,040 downside target aligns with the next logical support, and a close beneath it would open a path to $3,980.
Fundamental Drivers
Markets are still digesting last week's US GDP revision, which showed a modest deceleration but not enough to tip the Fed toward early easing. The data calendar is empty during Asian hours, leaving gold at the mercy of cross‑currents from the dollar and yields. The US 10‑year yield at 4.65% is a persistent weight; gold rarely sustains rallies when real rates are this high. Meanwhile, the British pound's calm after its bullish gap hints that currency markets are in a holding pattern, not driving safe‑haven flows.
Key Event to Watch
The most important risk event this week is Friday's non‑farm payrolls report for June, due on July 3. Consensus expects a 190,000 print, and a number above 220,000 would turbo‑charge the higher‑for‑longer narrative, likely pushing gold toward $3,920. Conversely, a miss below 150,000 could spark a short‑covering rally back to $4,033. Ahead of NFP, Wednesday's ISM Manufacturing PMI will provide an early temperature check. This economic chain means the current low‑volume drift could persist until mid‑week.
Devil's Advocate
The bearish view breaks down if gold manages to recapture $4,033 on a 4‑hour closing basis. Such a move would indicate a bear trap, triggering a short squeeze toward the 1‑hour upside target of $4,076. A sudden geopolitical shock — for instance an escalation in the Taiwan Strait or a surprise dovish speech from a Fed official — could serve as the catalyst. The line in the sand for the entire bearish structure is the MA50 at $4,107; a close above that would flip the bias to neutral‑bullish. Traders should monitor news wires closely during the session, but until the dollar drops, the dip‑buying thesis lacks conviction.
Trading Strategy for Asian Session
Given the thin liquidity, we favour a patient, reactive approach. The ideal short entry zone is $3,995–$4,005, targeting a fill just below the psychological $4,000 magnet. Place a stop loss at $4,036, above the MA20 and ATR‑adjusted buffer, to avoid noise. Take‑profit targets are $3,980 and $3,951. Use a reduced risk per trade — no more than 0.5% of capital — and consider splitting the position to lock in partial gains early. For traders who want to avoid leverage altogether in these choppy conditions, our halal gold trading platform offers interest‑free spot execution with physical backing, keeping risk proportionate to the market's true move. Should the market break below $3,980 with conviction, a momentum sell‑off toward $3,920 could develop, and wider stops above $4,020 would be prudent. If you prefer to follow expert-analyzed setups rather than hunting for entries alone, professional gold trading signals can deliver real‑time alerts tailored to current market conditions.
Key Takeaways
- Gold price trades at $3,983.20, well below the MA20 of $4,033.14 and the MA50 of $4,107.29.
- RSI 39.7 suggests bearish momentum is not yet exhausted; oversold territory could be tested before any bounce.
- Broken supports at $4,234.79 and $4,182.58 now act as overhead resistance, underscoring the bearish structure.
- The ATR‑based daily range projects a low near $3,966 and a high near $4,000 — expect this band to hold during Asian hours.
- Friday's NFP is the week's binary risk event; a strong jobs print could push gold below $3,950.
- A sustained move above $4,033 would negate the near‑term bearish bias and open a run to $4,076.
Conclusion
Gold price begins the final quarter under significant bearish pressure, with the Asian session casting a shadow over any immediate recovery hopes. The break below $4,234 support has recalibrated the medium‑term outlook, and the $3,980 level is the next domino to fall. Sellers will defend the $4,000–$4,033 zone aggressively; until the price reclaims that area, every rally is a potential short entry. Long‑term bulls may see this dip as a chance to purchase physical gold at a discount, but near‑term traders should respect the trend. Keep positions light, let London set the tempo, and treat the rest of the Asian session as a preparation window rather than an action phase.
Frequently Asked Questions
- Why is gold falling during the Asian session?
- Thin liquidity and a lack of fresh catalysts have allowed sellers to push gold price to $3,983.20, extending the bearish momentum that began after the break of $4,234 support.
- What is the next critical support level for gold?
- Immediate support sits at $3,980. A breakdown below that level would expose $3,950 and potentially $3,920 ahead of Friday's NFP release.
- How does the current RSI reading influence gold's outlook?
- The 14‑period RSI at 39.7 shows there's still room to the downside before oversold territory. This suggests sellers remain in control and a bounce may need a deeper washout first.
- Should I buy gold now or wait for a clearer signal?
- Short‑term traders can look for short entries near $4,000 with stops above $4,033. Risk‑averse investors might wait for a daily close above $4,107 — the 50‑day MA — before considering long positions.
Trading Gold (XAU/USD) carries significant risk of loss and is not suitable for all investors. This content is for informational purposes only and does not constitute financial advice. Always conduct your own research and trade responsibly.