Gold price kicked off the European session on 29 June 2026 at $4,061.21, hovering just below Monday’s Asian high. The metal briefly reclaimed the $4,072 level Tuesday but stalled as traders digested last Friday’s Core PCE print. The Fed’s preferred inflation gauge rose 2.8% year‑on‑year, yet the US Dollar Index failed to rally and actually retreated, giving gold bulls a temporary lifeline. Now, with London desks opening and liquidity surging, the real test begins. The momentum‑aware environment puts the immediate 1‑hour pivot at $4,076 and the floor at $4,048 — a break of either will set the tone for the rest of the week.
What’s Driving Gold Price Today?
Gold price action doesn’t happen in a vacuum. It’s a tug‑of‑war between interest‑rate expectations, inflation data, and global risk appetite. Last Friday’s Core PCE figure — the Fed’s favourite inflation bellwether — came in at 2.8% year‑on‑year, essentially flat from the prior reading. Markets had braced for a hotter number, so when the print merely matched expectations, rate‑hawk bets cooled and the greenback slipped. A retreating Dollar Index is typically rocket fuel for the gold price because it makes the metal cheaper for overseas buyers.
Real yields are another piece of the puzzle. The 10‑year TIPS yield has drifted sideways near 1.9%, signalling neither a recession panic nor runaway growth. In this kind of environment, gold price tends to grind higher on dips rather than spike and collapse. Geopolitical noise — simmering tensions in the Middle East and uncertainty around the next US trade policy tweaks — also keep a steady bid under the metal. Traders will now watch Friday’s revision of Q1 GDP and the University of Michigan sentiment survey. Any hint of stagflation could push the gold price through the $4,076 resistance before the weekend.
Technical Outlook for Gold Price
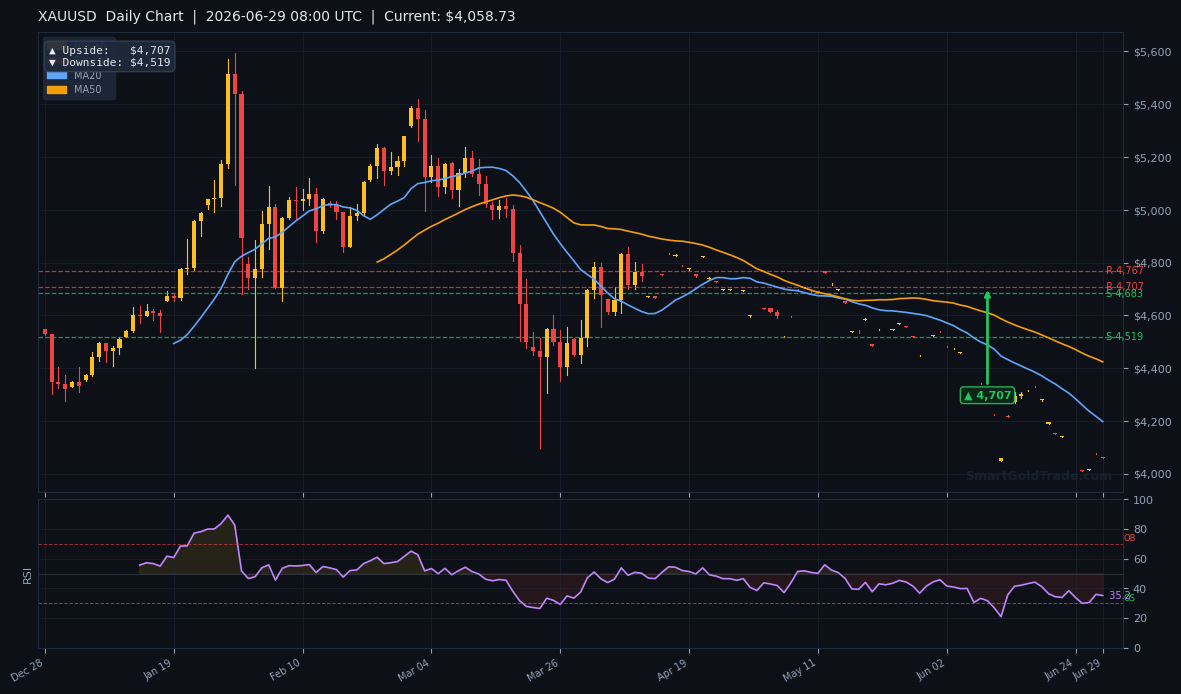
Charts show the gold price carving out a textbook consolidation box between $4,048 and $4,076 on the 1‑hour timeframe. This range has held since Monday’s Asian session, and the longer it persists, the more explosive the eventual breakout will be. The 50‑period simple moving average sits at $4,058, right on top of the European open. When price hugs the 50‑SMA without conviction, it usually means the big money is waiting for a catalyst.
Key Intraday Levels to Watch
- Immediate resistance: $4,076 (prior swing high, 23‑June top)
- Secondary resistance: $4,089 (mid‑May double top)
- Pivot support: $4,048 (June low, 12‑day EMA)
- Breakdown floor: $4,020 (psychological level, 100‑day SMA)
A decisive 1‑hour close above $4,076 opens the door to $4,105, while a loss of $4,048 likely triggers stop‑loss orders and accelerates the decline toward $4,020. For position traders, the weekly chart remains constructive — gold price prints higher lows as long as the $3,990 region holds. So far in 2026, every 3‑to‑5% dip has been bought aggressively, a pattern that encourages dip‑buyers.
Momentum oscillators are neutral: the RSI on the daily chart hovers at 54, and the MACD histogram is flat. That doesn’t scream “sell” or “buy,” but it does suggest that the trend is consolidating, not reversing. If you’re looking to enter, waiting for confirmation above $4,076 or a false breakdown below $4,048 is a sensible risk‑management approach.
Trading Gold Price Moves Without Riba
Spotting levels is one thing; executing trades in a Shariah‑compliant way is another. Conventional trading platforms often rely on CFDs, overnight swaps, or margin interest — all of which involve riba and can render the trade impermissible. SmartGoldTrade’s interest‑free spot gold trading avoids those pitfalls by giving you direct physical ownership of gold on every trade. There’s no leverage, no swap fees, and every position is backed by allocated gram lots, so you’re always trading what you own.
When the gold price moves, you can open a buy or sell position on XAU/USD in seconds. It’s a clean, transparent structure that resonates with traders who want to participate in price action without compromising their faith. With the current gold price hovering near $4,061, a gram‑based lot system lets you scale in with precision — no need to over‑commit capital just to catch a swing. You can trail a tight stop below $4,048 and target a breakout without worrying about hidden financing costs eating into your profit.
How Today’s Gold Price Affects Physical Bullion Ownership
Not everyone wants to actively trade the gold price. Some investors prefer a quieter strategy: buying physical metal and holding it through market cycles. At $4,061 per ounce, gold’s role as a store of value has never been clearer. SmartGoldTrade’s purchase physical gold coins and bars allows you to lock in the current gold price with certified 22K coins (1g to 5g) and 24K bars (10g). The metal is delivered to your door or stored securely, and the ownership transfer is immediate, with no riba‑based financing attached.
Holding physical gold decouples your wealth from inflationary pressure and currency depreciation — a real consideration when the Dollar Index can swing 1% in a session. When the gold price trends up over years, your coins and bars reflect that gain without counterparty risk. It’s a tangible hedge against the kind of slow‑burn inflation the Core PCE data hints at. For many families, it’s the simplest way to participate in gold’s long‑term story without a screen open all day.
Using Trading Signals to Capture Gold Price Swings
Technical analysis can feel like guesswork if you’re new to the market. That’s why a growing number of retail traders lean on unbiased, algorithm‑assisted alerts. Resources like professional gold trading signals crunch the same indicators — moving averages, volume profile, and pivot clusters — and deliver entry, stop‑loss, and take‑profit levels via Telegram. When the gold price squeezed into the $4,048–$4,076 range this week, professional signal charts flagged the compression five hours before most retail traders noticed it.
Pairing a disciplined signal feed with a Shariah‑compliant execution account creates a powerful edge. You get real‑time alerts that respect the rhythm of the gold price, and you execute on a platform that keeps your trades halal. It’s the best of both worlds: institutional‑grade analysis without riba contamination. Whether you’re aiming for a quick breakout scalp or a multi‑day swing, signals remove the emotion and let you trade the probabilities, not the panic.
FAQ
1. What factors influence the gold price most?
Gold price is driven by real interest rates, the US Dollar Index, inflation expectations, and geopolitical risk. When real yields fall or the dollar weakens, gold typically rises because it becomes cheaper for international buyers and competes better against yield‑bearing assets. Central bank buying and jewellery demand also play a role, especially during festive seasons in India and China.
2. Is it safe to buy gold when the gold price is above $4,000?
History shows that all‑time highs in gold price don’t deter long‑term investors. The metal acts as a portfolio stabiliser, not a speculative rocket. Dollar‑cost averaging into physical gold or trading with strict risk parameters removes the stress of timing the absolute top. The current macroeconomic backdrop — sticky inflation and geopolitical friction — supports a higher floor for the gold price over the medium term.
3. How can I trade the gold price in a Shariah‑compliant way?
You can trade the gold price without riba by using a spot platform that provides immediate physical ownership and avoids leverage, swaps, or interest charges. All trades are settled in allocated gram lots, so you’re buying and selling actual gold, not a derivative. This structure aligns with Islamic finance principles and lets you react to intraday price moves ethically.