Gold price is clinging to the $4,070 mark as the New York session kicks into gear, with sellers once again pressing the $4,065 downside pivot. Earlier this week, a surge in Fed rate-hike bets drove XAU/USD briefly below the psychological $4,000 handle—the first dip under that round number since May. The metal has since recovered roughly $70, but the bounce is running out of steam right where it matters most: at the intersection of short-term moving averages and persistent macro headwinds. This session will test whether the rebound is a dead-cat bounce or the foundation of a deeper recovery.
Gold Market Overview
Macro Context
The US Dollar Index (DXY) is holding above 105.00, supported by repriced expectations for a 25-basis-point rate hike at the July FOMC meeting. The 10-year Treasury yield has pushed back toward 4.52%, eroding the appeal of zero-yielding gold. Meanwhile, geopolitical jitters—ranging from lingering Ukraine uncertainty to simmering Middle East tensions—continue to provide a systemic bid, preventing a full-scale rout. This tug-of-war between yield-driven selling and haven demand is keeping the gold price trapped in wide, reactive swings.
Session Outlook
American session liquidity typically widens the intraday trading band by 30–50% compared to the Asian window. With the ATR(14) reading of $24.27, the expected range for this afternoon extends from about $4,040 to $4,100. Floor traders will watch two triggers: any unexpected hawkish Fedspeak from a scheduled panel discussion at 15:00 UTC, and the final hour of European bond market flow that often tests early-US stops. A clean break of intraday support around $4,065 would likely accelerate momentum, while a defense of that level could squeeze shorts toward the $4,100 region.
Technical Analysis
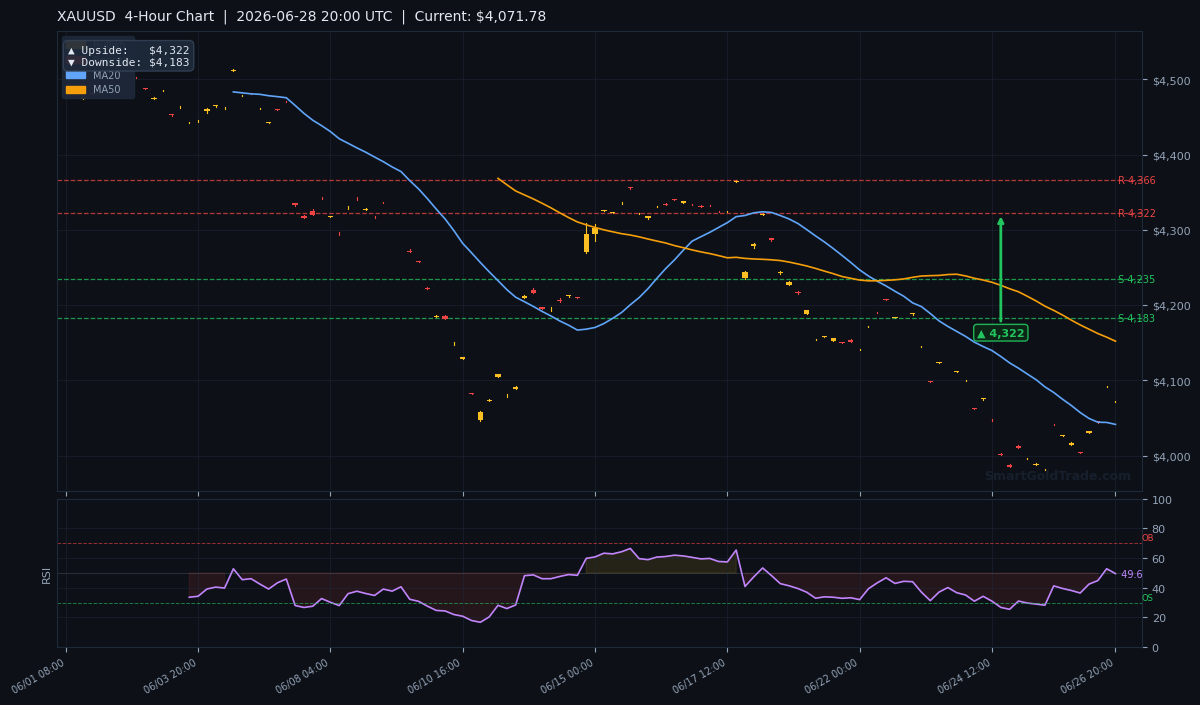
XAU/USD is printing mixed signals on the 4-hour chart, reflecting a market that has not yet committed to a direction after the sharp early-week drop. The current quote of $4,070.51 sits above the short-term moving average but remains firmly below the medium- and long-term trend indicators—a classic setup for either a breakout or a trap.
Moving Average Structure
The MA20 stands at $4,041.38, and with price above it, the very short-term bias is modestly bullish. However, the MA50 at $4,151.95 and the MA200 at $4,372.27 are both overhead, confirming bear territory on any timeframe beyond the intraday. The EMA structure shows MA20 still below MA50, which maintains short-term bearish pressure until the 20-period average can cross back above.
RSI and Momentum
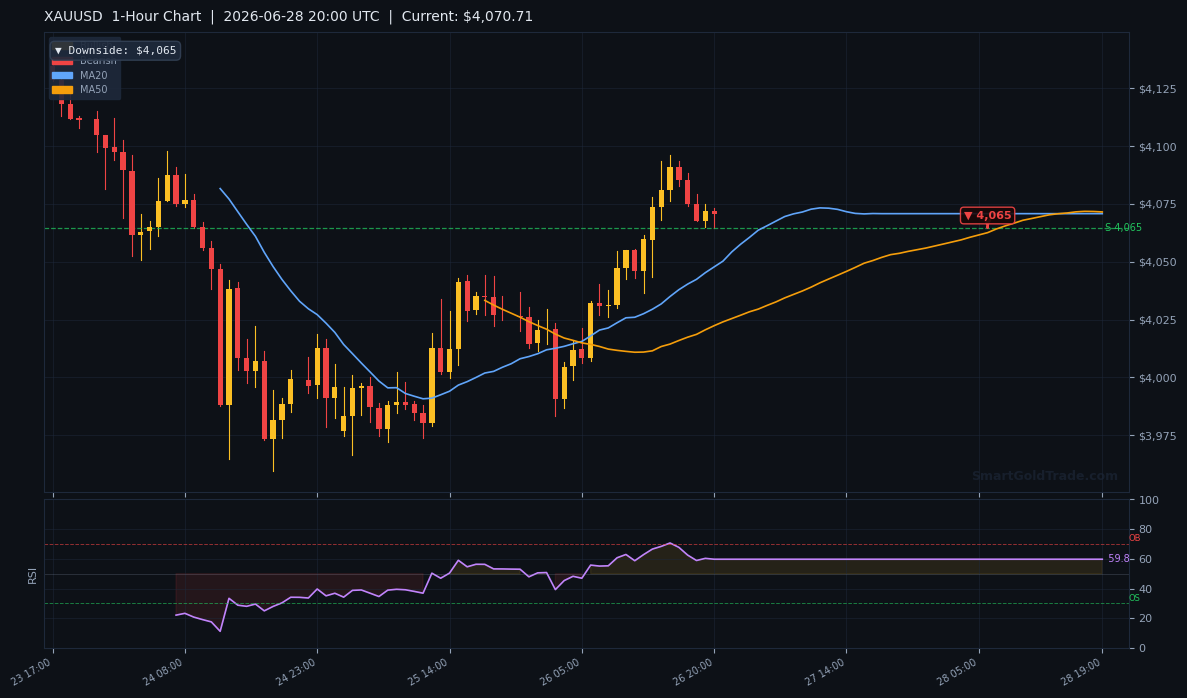
The 14-period RSI reads 49.6, dead in the neutral zone. This lack of overbought or oversold extremes means the trend is not exhausted in either direction, leaving room for a continuation move once the session picks a lane. A push above 50 on the RSI would align with a bullish break of $4,100, while a drop below 45 could confirm the bearish pivot at $4,065.
Key Price Levels
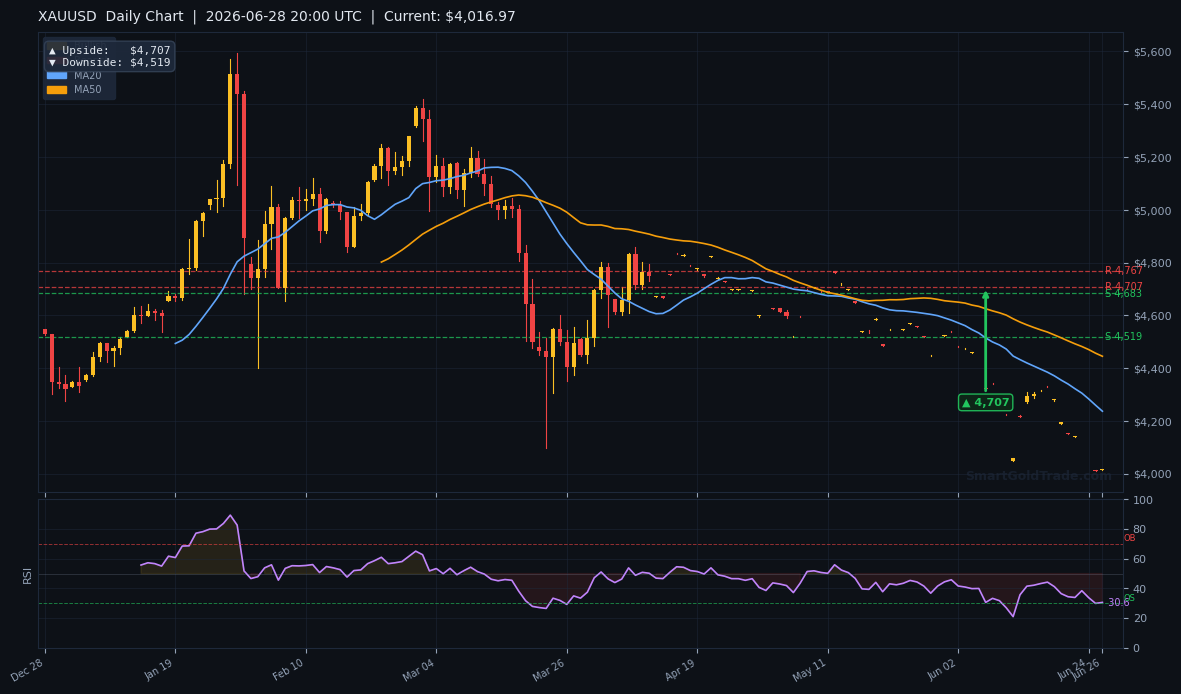
From the indicator set, the computed levels highlight the scale of the recent breakdown. The Support S1 at $4,313.77 and S2 at $4,234.79 now act as significant upside barriers—former support flipped to resistance after the breach below $4,000. Resistance R1 at $4,365.61 and R2 at $4,356.90 are distant ceilings that will only come into play if the macro backdrop shifts. On the downside, the 4-hour pivot arrow marks $4,183 as the next major floor, while the 1-hour breakdown target sits squarely at $4,065. The ATR(14) of $24.27 translates to a likely daily range of roughly $48.50, placing the session band between $4,046 and $4,095.
Fundamental Drivers
Last week’s surprisingly strong US retail sales print and hawkish FOMC minutes reignited rate-hike bets across the curve, sending the gold price crashing below $4,000 for the first time in weeks. The move was exacerbated by algorithmic selling and thin liquidity ahead of the London fix. Even as spot has recovered, the fundamental narrative has not changed: the Fed is still data-dependent, and any additional strength in US consumption will harden the hawkish stance.
Key Event to Watch
The single most important risk event for gold this week is Thursday’s US core PCE price index—the Fed’s preferred inflation gauge. A reading above the consensus 0.3% month-on-month would likely send the gold price testing $4,000 once more, while a soft print could give bulls the green light to target the $4,183 pivot. Traders should also monitor Friday’s University of Michigan sentiment revision for any inflation expectation creep.
Gold Price and Islamic Wealth Preservation
For investors following Islamic finance principles, pullbacks in the gold price can present long-term accumulation opportunities. Physical gold—whether held as coins, bars, or through shariah-compliant spot trading—offers a riba-free store of value that aligns with the prohibition on interest. The recent dip below $4,000, while unsettling for leveraged traders, may appeal to those who want to increase their gold exposure at a discount without engaging in speculative leverage. This approach turns volatility from a threat into a tactical advantage, especially when core PCE data threatens to shake out short-term positions. By focusing on tangible ownership and avoiding interest, halal investors can use gold as both a hedge against fiat uncertainty and a tool for long-term wealth preservation.
Devil's Advocate
The bearish thesis hinges on the assumption that the gold price cannot reclaim the $4,183 4-hour pivot and the $4,234.79 former support zone. If buyers manage to push XAU/USD above that cluster—and especially if they close a 4-hour candle above $4,152 (the MA50)—the short setup invalidates. In that scenario, a rapid short-squeeze could propel price toward the $4,313.77 resistance. Conversely, if geopolitical tensions escalate suddenly, the safe-haven bid could override rate dynamics, flipping the bias to bullish within a single session.
Trading Strategy for American Session
With the market hovering just above the make-or-break $4,065 level, the highest-probability trade is a short on a confirmed breakdown. Wait for a 1-hour close below $4,065 to avoid a fakeout, then enter with a stop at $4,100, which sits above the upper band of the expected ATR range and recent swing highs. The initial take-profit target is the psychological $4,000 level, with an extended target at $3,940—a prior structural low from May. This setup offers a risk-to-reward ratio of approximately 1:1.9.
For those who prefer to trade the bounce, a daily close above $4,100 would flip the bias and open a path to $4,183, but that scenario requires a fundamental catalyst. Traders who want to eliminate execution delay can consider professional gold trading signals that align entry, stop, and target levels with real-time technicals. Those seeking a fully Shariah-compliant approach without leverage or interest can explore halal gold trading with physical ownership and gram-based lots.
Key Takeaways
- Gold price at $4,071 remains vulnerable below the $4,152 MA50 and $4,372 MA200.
- A break of the $4,065 1-hour pivot would likely accelerate selling toward $4,000.
- RSI at 49.6 signals no oversold exhaustion; momentum can extend in either direction.
- The ATR(14) of $24.27 projects a session range of roughly $4,046–$4,095.
- Former support at $4,313.77 now marks a formidable upside barrier.
- Thursday’s core PCE release is the week’s top risk event for gold direction.
Conclusion
The gold price is at a short-term inflection point this American session. The bounce from the sub-$4,000 breakdown has lost momentum beneath the $4,152 mid-term moving average, and the $4,065 support holds the key to the next leg. A confirmed push below that level likely drags XAU/USD back to the $4,000 psychological floor, while a defense sets up a grind toward $4,100 and $4,183. The macro backdrop continues to favor downside, but the safe-haven undercurrent demands respect. Investors mindful of long-term wealth preservation may also consider physical gold products as a hedge against monetary uncertainty. The rest of the week’s data will ultimately decide whether the trend resolves bearish or stages a counter-trend rally.
FAQ
- What is the short-term trend for gold?
- Short-term, XAU/USD holds above the $4,041 MA20 but faces bearish pressure below the $4,152 MA50. A decisive break below $4,065 would confirm a downtrend, while a close above $4,100 could shift momentum to neutral.
- Where is the next support for XAU/USD?
- Immediate support sits at $4,065 (1-hour pivot). Below that, the psychological $4,000 handle and the May structural low near $3,940 are the next downside magnets.
- What is the most important economic event for gold this week?
- Thursday’s core PCE price index is the main event. A hotter-than-expected reading could reinforce Fed hawkishness and push the gold price back below $4,000; a soft number would support a rally toward the $4,183 zone.
Trading Gold (XAU/USD) carries significant risk of loss and is not suitable for all investors. This content is for informational purposes only and does not constitute financial advice. Always conduct your own research and trade responsibly.