Gold Price Forecast Next Week: NFP Week Could Test $4,000 Support (June 28–July 3)
Our gold price forecast next week covers June 28–July 03, 2026, with gold (XAU/USD) trading at $4,070.51, having just staged a dramatic rebound from sub‑$4,000 levels. Prices briefly crashed below the psychological $4,000 handle for the first time in eight months, only to bounce sharply on sliding US Treasury yields. This week’s outlook dissects the technical landscape, the high‑impact US jobs data, and three trading scenarios, giving you a clear roadmap for a week that promises explosive moves.
Last Week in Review
Price Action Recap
The week opened near $4,150, but by Tuesday a relentless wave of hawkish Federal Reserve repricing dragged XAU/USD below the symbolic $4,000 barrier for the first time since November 19, 2025. The sell-off reached a trough around $3,920 on Wednesday, triggering forced liquidations. From that low, gold mounted a methodical recovery: Thursday brought consolidation above $3,980, and Friday’s PCE-inspired yield drop catapulted the metal back to a close of $4,070, virtually erasing the entire weekly loss. The weekly candle forms a long lower shadow, a classic rejection of sub‑$4,000 levels—and this price action sets the backdrop for our gold price forecast next week.
Key Events That Moved Gold
Two forces dominated. First, a string of hawkish Fed commentary and robust US durable goods orders intensified bets that the June FOMC meeting would produce another 25‑basis‑point hike, sending the Dollar Index to fresh 18‑month highs and gold to its $3,920 low. Second, the Core PCE Price Index, released on Friday, printed at 4.3% YoY—hotter than the 4.2% consensus—but the details showed a deceleration in services inflation, causing benchmark 10‑year yields to drop 12 basis points. That yield retreat, combined with a stale Dollar, fueled the rapid rebound that salvaged the week for gold bulls.
Weekly Close Analysis
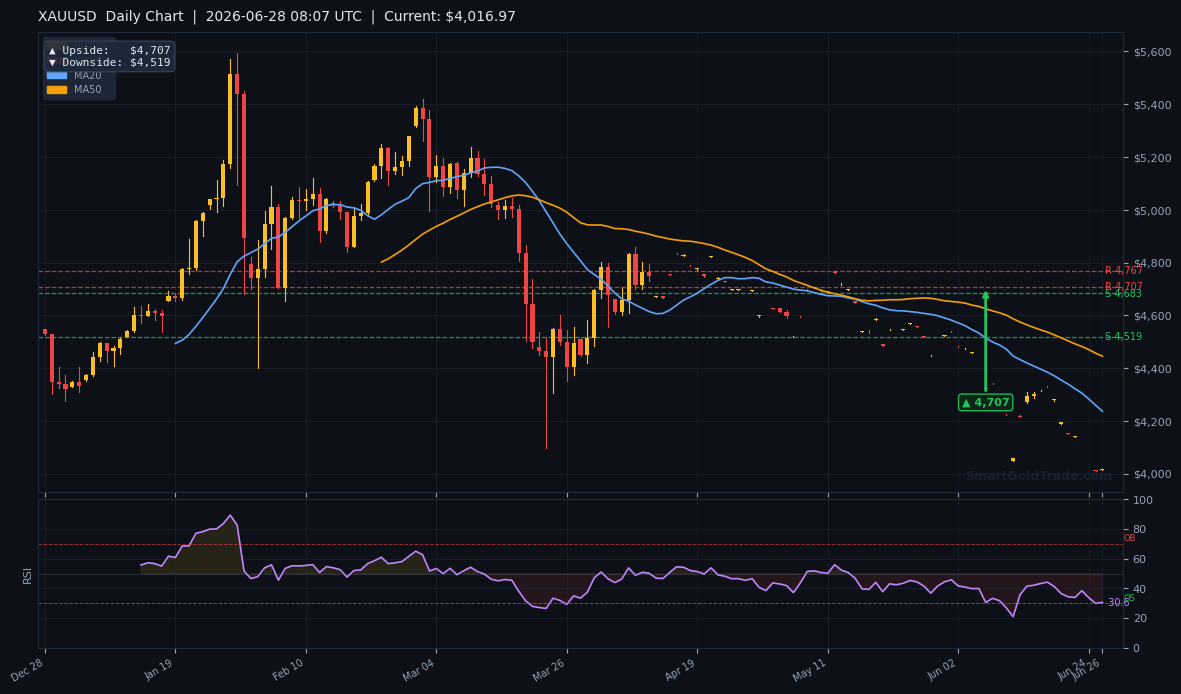
The Friday close of $4,070 reclaimed the $4,000 mark but settled well below the 20‑period MA ($4,041) by the final print—a marginally bullish short‑term signal, yet still deeply entrenched below the 50‑week and 200‑week moving averages. The weekly candlestick’s long lower wick signals strong buying interest at discount prices, but the body remains red, and the trailing four‑week losing streak confirms that bears are in control of the medium‑term trend. For the bearish cycle to truly end, a weekly settlement above $4,234 is required.
Next Week Economic Calendar & Gold Impact
The holiday‑shortened week (US Independence Day on July 4) condenses all high‑impact releases into Monday–Friday, with Friday’s Nonfarm Payrolls as the centerpiece. Each data point will be scrutinized for clues on the Fed’s July rate decision, and the resulting Dollar swings will directly dictate gold’s path. This calendar is central to our gold price forecast next week.
| Day | Event | Forecast | Previous | Gold Impact |
|---|---|---|---|---|
| Mon, Jun 29 | Chicago PMI (Jun) | 42.5 | 41.3 | Beat = hawkish, bearish for gold; Miss = dovish, bullish |
| Tue, Jun 30 | ISM Manufacturing PMI (Jun) | 49.0 | 48.7 | Above 50 (expansion) = negative for gold; Below = positive |
| Tue, Jun 30 | JOLTS Job Openings (May) | 8.2M | 8.1M | Higher openings = tighter labor, bearish for gold |
| Wed, Jul 1 | ADP Nonfarm Employment (Jun) | 170K | 185K | Strong print = Dollar bid, gold under pressure |
| Thu, Jul 2 | ISM Services PMI (Jun) | 52.5 | 51.9 | Services inflation proxy; strong = hawkish, gold negative |
| Thu, Jul 2 | Initial Jobless Claims | 230K | 228K | Spike = weak labor, supportive for gold; Drop = headwind |
| Fri, Jul 3 | Nonfarm Payrolls (Jun) | 180K | 220K | Beat >210K = hawkish shock, gold tumbles; Miss <150K = rate‑cut hopes, gold surges |
| Fri, Jul 3 | Unemployment Rate (Jun) | 3.7% | 3.8% | Drop = hawkish; Rise = favorable for gold |
| Fri, Jul 3 | Avg. Hourly Earnings (MoM) | 0.3% | 0.3% | Above 0.3% = inflation fears, gold first dips then hedges higher |
Friday’s NFP print is the definitive trigger: a blowout number above 210K will reanimate Fed hike bets and likely drag gold back toward $3,920, whereas a sub‑150K reading could ignite a squeeze through $4,151. Liquidity will thin ahead of the US holiday, so expect exaggerated whipsaws around the numbers.
Technical Analysis
The technical picture provides the levels that matter most for our gold price forecast next week.
Moving Average Structure
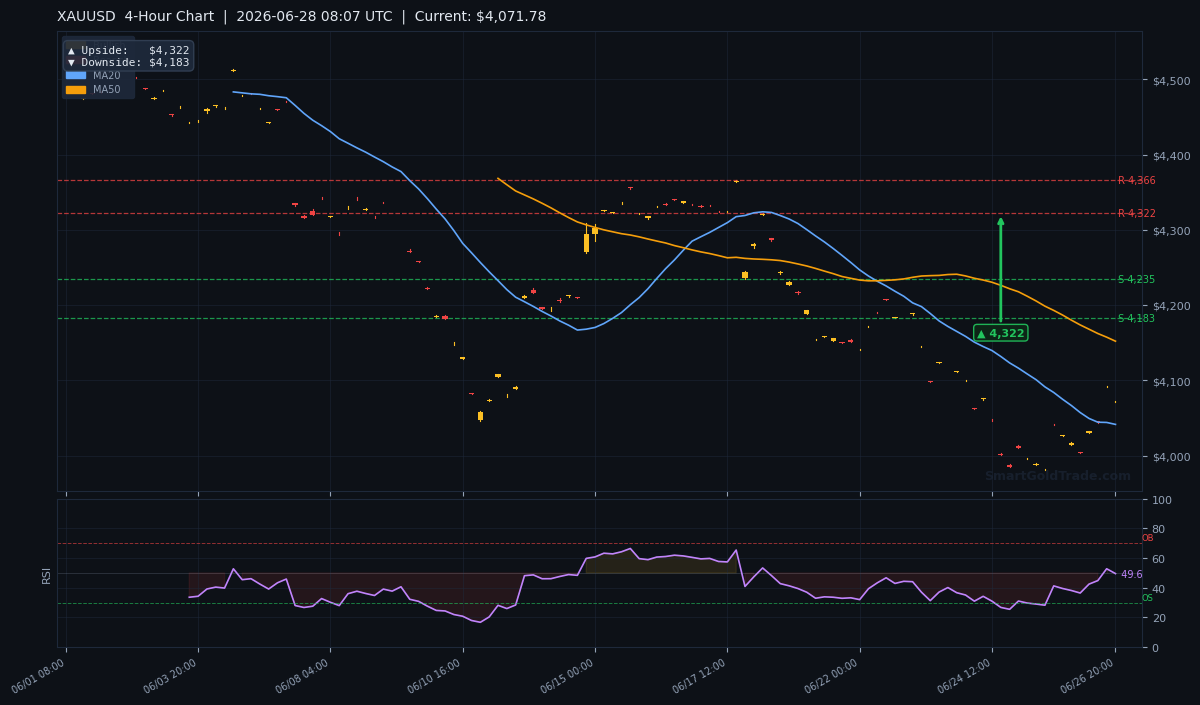
The 4‑hour moving averages paint a conflicted picture. Price currently trades above the 20‑period MA ($4,041.38), generating short‑term bullish momentum. However, it sits below the 50‑period MA ($4,151.95) and the 200‑period MA ($4,372.27), confirming a dominant bearish medium‑ and long‑term trend. Even more telling, the exponential moving averages are stacked with the MA20 residing below the MA50—an indication of persistent short‑term bearish pressure. Until the MA20 crosses above the MA50, any bounce should be treated with skepticism.
RSI and Momentum
The 14‑period RSI stands at a perfectly neutral 49.6, leaving room for movement in either direction. There is no divergence to exploit, and momentum is flat. The Average True Range (ATR) is $24.27, projecting a typical daily range of roughly $4,046–$4,095, though event days will easily breach that band.
Key Support and Resistance Levels
Exact pivot analysis identifies critical zones that must be respected:
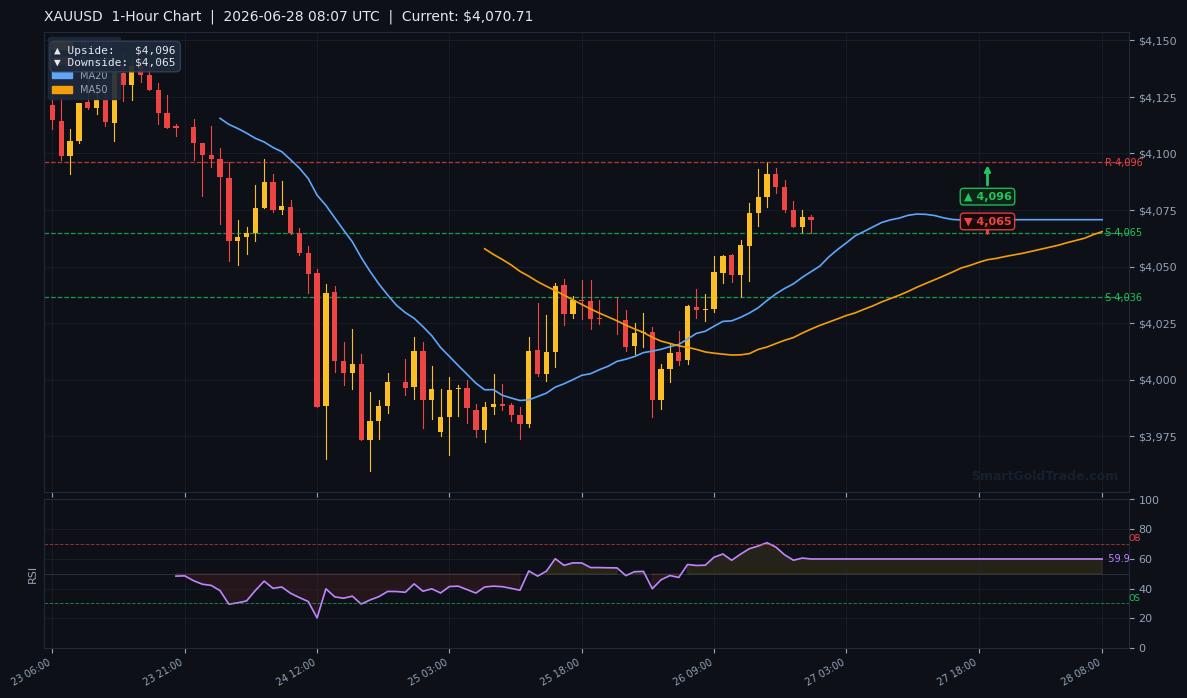
- Immediate resistance: $4,096 (1‑hour upside target), then $4,151.95 (50‑period MA).
- Strong resistance cluster: $4,234.79 (S2 turned resistance) and $4,313.77 (S1 turned resistance). A daily close above $4,313 would signal a regime change.
- Daily chart upside target: $4,707, a level that aligns with the former structural floor from Q1 2026.
- Immediate support: $4,065 (1‑hour downside target), followed by the psychological $4,000 round number.
- Major support: $3,920 (last week’s low); below that, the $3,800 2024‑style breakdown zone opens.
Notably, the daily chart also identifies a downside target of $4,519—well above current price—which functions as a potential resistance pivot should gold rally and fail, creating a high‑probability short‑side re‑entry zone. These zones form the battlefield for our gold price forecast next week.
Trading Scenarios This Week
Three detailed scenarios shape our gold price forecast next week.
Bullish Scenario (probability 35%)
Trigger: A strong NFP miss on Friday (sub‑150K) or a daily close above the 50‑period MA ($4,151.95) earlier in the week.
Entry zone: $4,150–$4,200 on a confirmed breakout.
Targets: First objective is the 4‑hour upside target of $4,322, followed by resistance at $4,365.61 (R1). A clean break there opens the path to the daily bull flag target of $4,707.
Stop‑loss: Below $4,000, as a failure to hold that psychological floor invalidates the bullish breakout.
Catalyst: A dovish NFP + a break of the moving average resistance could trigger a massive short‑squeeze, especially with thin post‑holiday liquidity.
For traders who prefer a hands‑off approach during explosive moves, copy trading allows you to mirror top‑performing gold strategies automatically, capturing breakouts without sitting in front of the screen.
Professional gold trading signals can also pinpoint precise entry and exit levels for this high‑volatility week, adding an extra layer of confidence.
Bearish Scenario (probability 55%)
Trigger: A rejection from the $4,234–$4,313 resistance zone, or a break below the 1‑hour downside target of $4,065, especially if fueled by strong US data.
Entry zone: Short on a push toward $4,150–$4,200 that stalls, with added confirmation if $4,065 breaks.
Targets: Initial target is the 4‑hour downside level of $4,183, followed by a retest of $4,000. A sustained break under $4,000 opens a quick path to $3,920 and potentially $3,800.
Stop‑loss: Above $4,321 (above the 4‑hour upside target), protecting against a false breakdown that could morph into a bear trap.
Catalyst: A strong NFP print above 210K or a hawkish Fed off‑cycle remark are the sparks that could send gold tumbling below $4,000 for the second time in two weeks.
This bearish outcome, with a 55% likelihood, dominates our gold price forecast next week.
Neutral / Range‑Bound Scenario (probability 10%)
If uncertainty ties the market before Friday, gold may oscillate between $4,000 and $4,151. Traders can buy near the lower bound with a stop under $3,990 and sell near the upper bound with a stop above $4,235. Mean‑reversion strategies using ATR‑based take‑profits around $30–$40 per leg are appropriate until the NFP breakout resolves the range.
Risk Factors to Watch
The greatest black‑swan risk is a geopolitical escalation—whether in the South China Sea or an energy supply shock—that could send oil prices soaring and gold spiking as a safe‑haven. Any unexpected geopolitical shock would instantly rewrite our gold price forecast next week.
Similarly, a sudden hawkish pivot from Fed officials between meetings could reignite Dollar strength and push gold back below $4,000. On the flip side, a deeper dive in bond yields could turbocharge the bullish scenario, so staying flexible is essential.
Gold Price Forecast Next Week: Final Verdict
Summing up our gold price forecast next week, the bias remains cautiously bearish heading into the NFP, but the $4,000 level is a line in the sand. A strong jobs report could smash support, while a weak one might ignite a short‑squeeze toward $4,234. For traders who want to sit back, our copy trading feature lets you mirror savvy gold strategies automatically. And for Shariah‑compliant investors seeking a hands‑off approach, our mudarabah investment plans offer managed exposure to gold without the daily screen time.
FAQ
What is the gold price forecast next week?
Our gold price forecast next week examines the June 28–July 3 trading window, highlighting critical levels around $4,000 and $4,151. The most probable outcome is a bearish tilt driven by a strong NFP, though a weak jobs report could flip the script quickly. We lay out clear bullish, bearish, and range‑bound scenarios so you can prepare for any outcome.
Why does the NFP report affect gold prices so much?
The Nonfarm Payrolls release shapes Federal Reserve rate expectations almost immediately. A hotter‑than‑expected number suggests the Fed will keep hiking, which boosts the US Dollar and pressures dollar‑denominated gold. Conversely, a disappointing print fuels rate‑cut hopes, weakening the Dollar and sending gold higher. Last week’s yield plunge after the PCE data shows how quickly rate repricing can lift gold.
Can I trade gold based on a weekly forecast?
Absolutely, but treat it as a roadmap, not a guarantee. A gold price forecast next week identifies high‑probability zones and triggers, helping you plan entries, targets, and stops. Using tools like copy trading can help you execute the plan without emotion. Always combine the forecast with your own risk management and stay update on unfolding news.