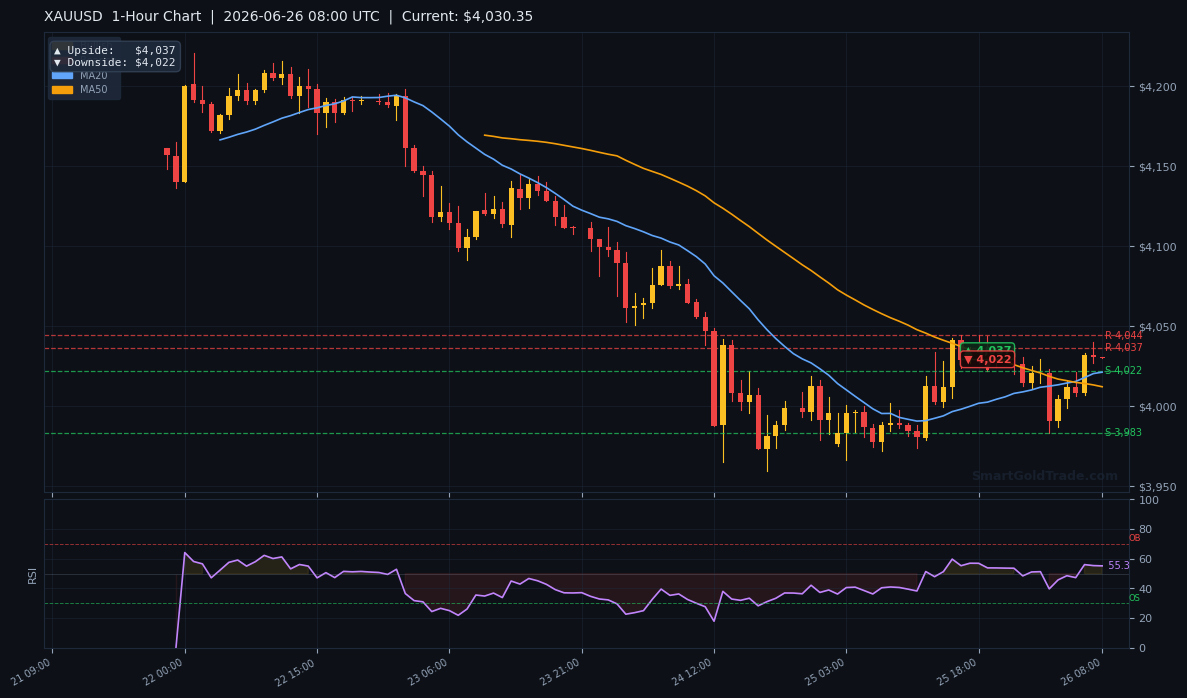
Gold price is currently trading at $4,048.28 as of 10:30 UTC on June 26, having surged through the critical $4,037 resistance earlier in the European session. The move follows a successful defense of the $4,022 support level that held firm during Asian hours.
Current Gold Price and Market Overview
Macro Context
The US Dollar Index (DXY) continues to trade near 105.2, while the 10‑year Treasury yield holds at 4.35%. This combination typically keeps non‑yielding gold under structural pressure, yet the early-session breakout shows that momentum can shift even without a major catalyst. The Federal Reserve’s hawkish posture, reinforced by last week’s FOMC minutes, had sapped bullish sentiment earlier in the week. Geopolitical undercurrents — including simmering trade disputes — still offer only fleeting safe‑haven bids, but today’s price action suggests a short‑squeeze is unfolding. For the rally to sustain, traders now need a clear break above the H4 MA20 at $4,057.12.
Session Outlook
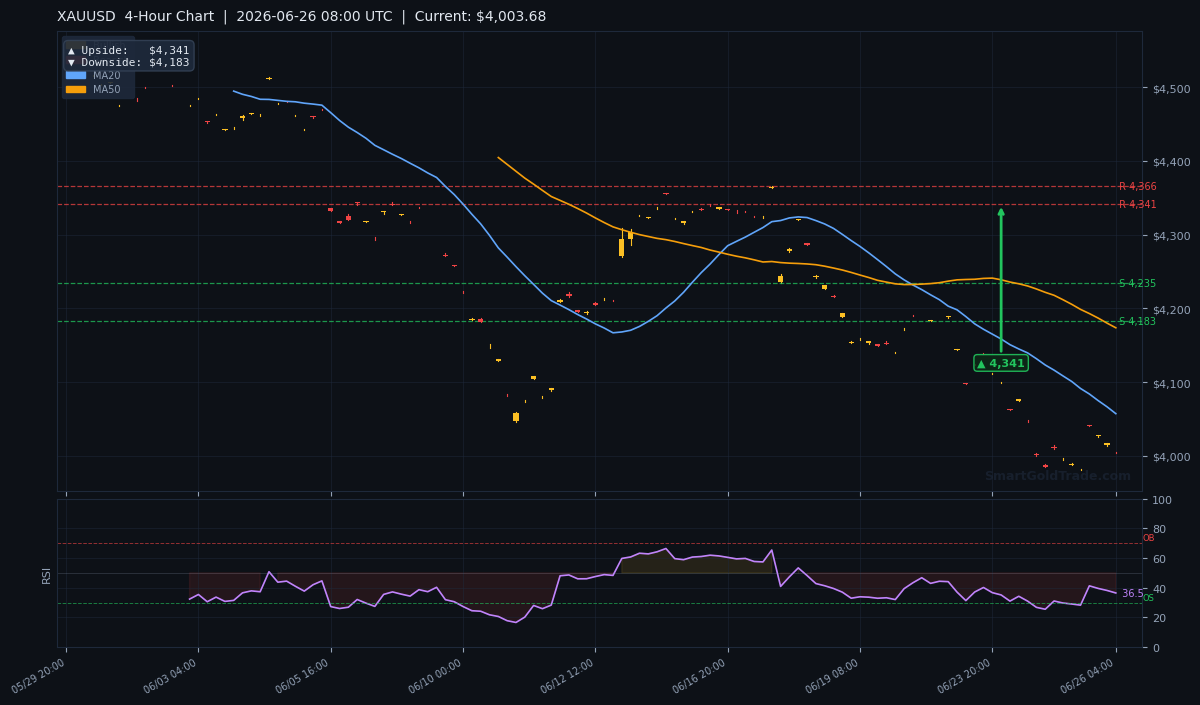
The European session injected both volume and conviction, shattering the $4,037 ceiling. With spot gold at $4,048.28 and the H4 snapshot earlier at $4,003.68, the breakout above $4,037 shifts the focus to the next hurdle — the MA20 at $4,057.12. The ATR(14) reading of $23.17 implies a normal daily range of roughly $46, which puts $4,070 within reach if momentum persists. Immediate support now stands at the prior resistance $4,037, while a dip back below $4,022 would invalidate the breakout and quickly re‑engage bears.
Technical Analysis
Moving Average Structure
On the H4 chart, gold currently prints at $4,048.28, still modestly below the MA20 at $4,057.12, the MA50 at $4,173.57, and the MA200 at $4,385.25. This alignment had confirmed a bearish trend, but a decisive close above the MA20 would be the first technical signal that the downtrend is stalling. Crucially, the MA20 remains below the MA50, meaning short‑term momentum is still leaning negative — a recovery must prove itself above $4,057 to change that dynamic.
RSI and Momentum
The RSI(14) was measured at 36.5 earlier in the day, right at the upper edge of the neutral zone but leaning toward oversold. With the subsequent breakout, the gauge has likely pushed higher. If the RSI can clear 40 while the gold price holds above $4,037, a short‑term rebound becomes mechanically more probable. A dip back below 30 would signal that selling pressure has reasserted and likely coincide with a failure of the breakout.
Key Price Levels
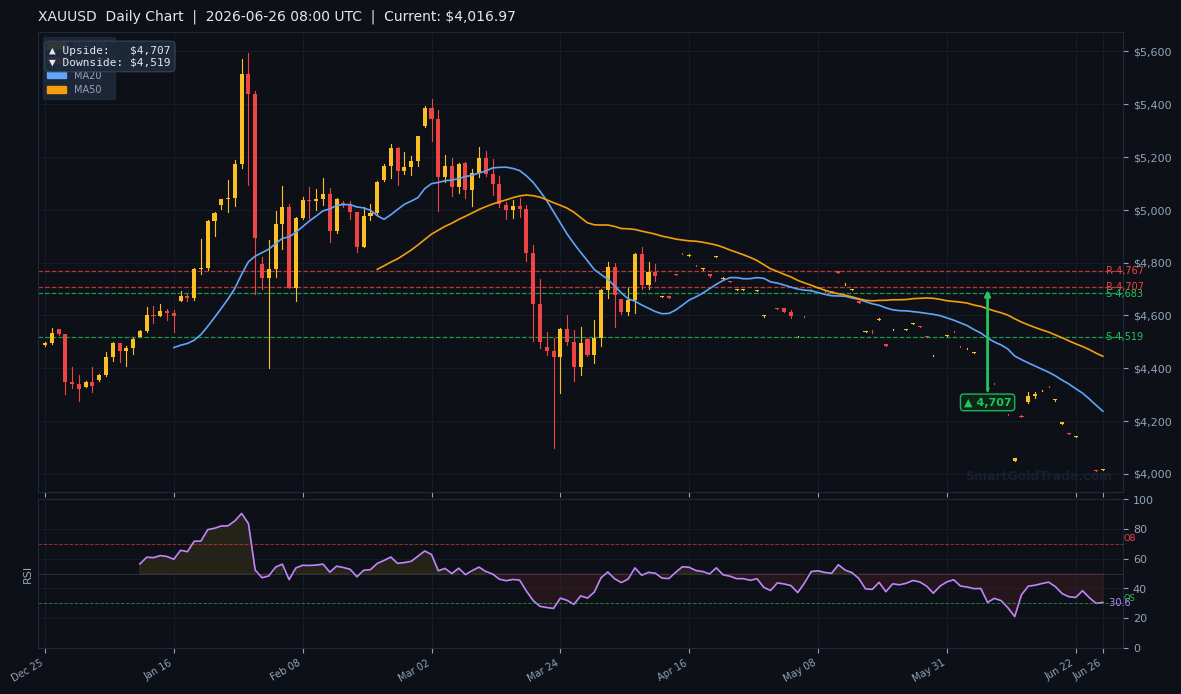
Immediate support steps up first at $4,037 (former resistance), with the more significant floor at $4,022 — a break of which would open a fast lane to the 4‑hour downside target of $4,183. On the upside, the MA20 at $4,057.12 is the initial barrier, followed by the 4‑hour upside pivot at $4,341. The daily chart’s own targets sit much farther out at $4,707 (up) and $4,519 (down). The ATR(14) of $23.17 means a normal daily swing is about $46, so a close above $4,057 would be a statistically significant move worth respecting.
| Timeframe | Upside Target | Downside Target |
|---|---|---|
| 1‑Hour | $4,037 | $4,022 |
| 4‑Hour | $4,341 | $4,183 |
| Daily | $4,707 | $4,519 |
Fundamental Drivers
The Spanish GDP print — the only notable data release this morning — landed exactly on forecast at 0.6%, offering no new impetus for euro‑linked gold buying. The real driver remains the dollar’s resilience. With the DXY holding above 105 and US real yields nudging higher, the gold price’s breakout is even more impressive. It suggests a round of short‑covering rather than a fundamental rerating. Without a dovish surprise from a Fed speaker or a sharp drop in Treasury yields, the fundamental backdrop still favors pressure. However, the technical breakout itself can attract momentum chasers who may not care about macro narratives in the short term.
Key Event to Watch
Looking ahead, the next major spark will likely be the US Core PCE Price Index, scheduled for release later in the month. A hotter‑than‑expected reading would validate the Fed’s hawkishness and could snuff out the rally, sending the gold price back below $4,022 toward the $4,183 zone. A soft number, however, would add fuel to the breakout, likely pushing price past $4,057 and testing the 4‑hour upside at $4,341.
Devil’s Advocate
The bearish thesis only fully crumbles if the gold price manages to close above the MA20 at $4,057.12 on the H4 timeframe. Such a close would break the sequence of lower highs and signal that short‑term momentum is decisively shifting. In that scenario, the path opens for a retest of the 4‑hour upside pivot at $4,341. If, however, the price fails to hold above $4,037 and slips back toward $4,022, the breakout story evaporates and the broader downtrend reclaims control.
Trading Strategy for European Session
Given the breakout above $4,037, the highest‑probability trade shifts to managing a long position. Bulls can look for entries on pullbacks to the $4,037–$4,040 zone, with a first take‑profit at $4,057 (the MA20) and a stop‑loss at $4,022 — a level that must hold to keep the breakout valid. More aggressive traders can target the 4‑hour upside at $4,341, but only after a confirmed close above $4,057.
On the flip side, a decisive drop back below $4,022 would revive the bear case, triggering short entries with an initial target of $4,183 and a protective stop at $4,045 (above the session high). Professional gold trading signals can help time such breakouts with precision, but always size positions according to your own risk tolerance.
How the Gold Price Impacts Long‑Term Halal Wealth
While intraday traders react to each tick, long‑term Shariah‑compliant investors read the gold price differently. Daily swings are noise; what matters is the metal’s century‑long role as a store of value. When short‑term pressure pushes gold lower, it can create an opportunity to purchase physical gold — certified 22K coins or 24K bars that provide full ownership, zero counterparty risk, and pure compliance with Islamic financial principles. Holding tangible gold is a time‑tested hedge against both inflation and currency debasement, and it aligns perfectly with the Shariah requirement of asset‑backed transactions. For those building a halal portfolio, physical bullion remains the bedrock.
Key Takeaways
- Gold price broke through $4,037 and reached $4,048.28, turning former resistance into immediate support.
- All major moving averages — MA20 at $4,057.12, MA50 at $4,173.57, MA200 at $4,385.25 — still point to a broader bearish structure until a close above MA20.
- RSI(14) at 36.5 (pre‑breakout) indicates the push higher has room to run if it clears 40.
- The ATR(14) of $23.17 suggests a typical daily swing of $46, making $4,057 and $4,022 the critical boundaries.
- A sustained move above $4,057 targets $4,341; a failure below $4,022 reopens the path to $4,183.
- The upcoming US PCE data remains the next fundamental trigger that could redefine the trend.
Conclusion
The gold price has seized the initiative this European morning, but the real test sits at $4,057.12. A close above that level would confirm a short‑term trend change, while a rejection could see the bears return with force. Traders should stay agile, respect the $4,037–$4,057 corridor, and let price confirm direction before committing. For those committed to ethical finance, SmartGoldTrade’s halal gold trading platform provides an interest‑free way to trade spot gold with full physical ownership, keeping every transaction Shariah‑compliant.
Frequently Asked Questions
What is the key support level for gold this session?
The immediate support is now $4,037, which was the resistance that gold broke through. A more significant floor rests at $4,022; a break below that would shift focus to $4,183.
Where is the next resistance if gold continues higher?
Intraday resistance now stands at the MA20 of $4,057.12. Beyond that, the 4‑hour upside target of $4,341 and the daily target of $4,707 come into play, but only if $4,057 is convincingly taken out.
Is gold still in a bearish trend?
Yes, from a medium‑term perspective. Price remains below the MA20 ($4,057), MA50 ($4,173), and MA200 ($4,385). The MA20 crossing below the MA50 reinforces short‑term bearish momentum. A close above $4,057 is needed to challenge the downtrend.
Trading Gold (XAU/USD) carries significant risk of loss and is not suitable for all investors. This content is for informational purposes only and does not constitute financial advice. Always conduct your own research and trade responsibly.