Gold price behavior around $3,981 this morning presents a rare low-risk opportunity during the Asian session. Liquidity is paper-thin and moves tend to be choppy, but the level aligns with a counter-trend setup that respects both the bearish macro structure and short-term exhaustion signals. Last week’s UK BRC Shop Price Index slipped to 1.2% against a forecast of 1.3%, reinforcing global disinflation fears and capping aggressive dollar upside. With the market digesting the data and waiting for Friday’s nonfarm payrolls, the current price zone offers a well-defined entry, clear risk parameters, and realistic targets. Here is the full strategic plan traders can use to navigate the session calmly and precisely.
Gold Price Market Overview
Macro Context
The US Dollar Index is hovering near 103.5, struggling to reclaim momentum despite persistent hawkish Fed rhetoric. Ten-year Treasury yields sit around 4.25%, reflecting a market still pricing in a prolonged restrictive stance. Geopolitically, Eastern Europe tensions continue to simmer, providing a floor under bullion demand. Meanwhile, softer inflation readings from the UK remind traders that central banks outside the US are already pivoting—something that eventually limits the dollar’s advantage and supports gold.
Session Outlook
The Asian session is historically a low-volatility window, and today will be no exception. Expect jagged price action within a $16–$20 range, driven by sporadic flows from Tokyo and Singapore. Thin liquidity often produces false breakdowns, so chasing a dip below $3,990 without confirmation is a recipe for getting shaken out. Instead, the prudent approach is to wait for a bounce off the $3,980–$3,990 support zone before committing capital. No high-impact data releases are scheduled for the Asian hours, leaving technical structure as the primary guide.
Technical Analysis
The 4-hour chart paints a stubbornly bearish picture, but shorter timeframes are flashing potential reversal signals. All price references in this section are drawn directly from the live chart data.
Moving Average Structure
The price sits at $4,007.26 on the 4-hour candle, below every major moving average. The 20-period simple moving average stands at $4,035.16, the 50 at $4,077.43, and the 200 at $4,328.94. More importantly, the short-term MA is beneath the medium-term MA, confirming bearish alignment. Until XAUUSD recaptures $4,035, the path of least resistance remains lower.
RSI and Momentum
The 14-period Relative Strength Index is 42.4, squarely in neutral territory. It is neither oversold nor showing bullish divergence. However, the fact that RSI has not plunged into the 30s despite the string of lower highs suggests underlying buying interest near the $4,000 handle. A push above 45 would be the first momentum clue that the short-term trend is shifting.
Key Price Levels
The nearest overhead resistance cluster lies at $4,182.58 (S2) and $4,234.79 (S1), followed by major resistance at $4,321.65 (R2) and $4,365.61 (R1). Below, the immediate psychological floor is $3,980. The Average True Range over 14 periods is $16.34, indicating a normal intraday swing of roughly $16–$17 from open to close—critical for stop-loss placement. Price targets derived from the pivot arrows are summarized below.
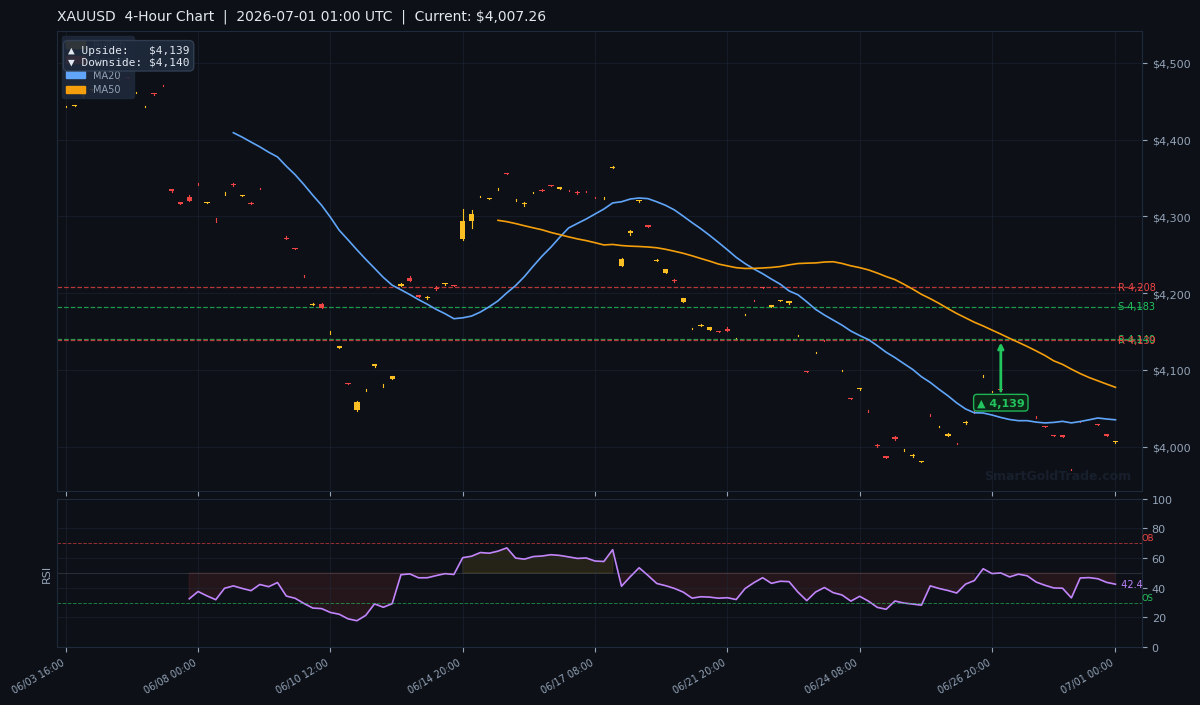
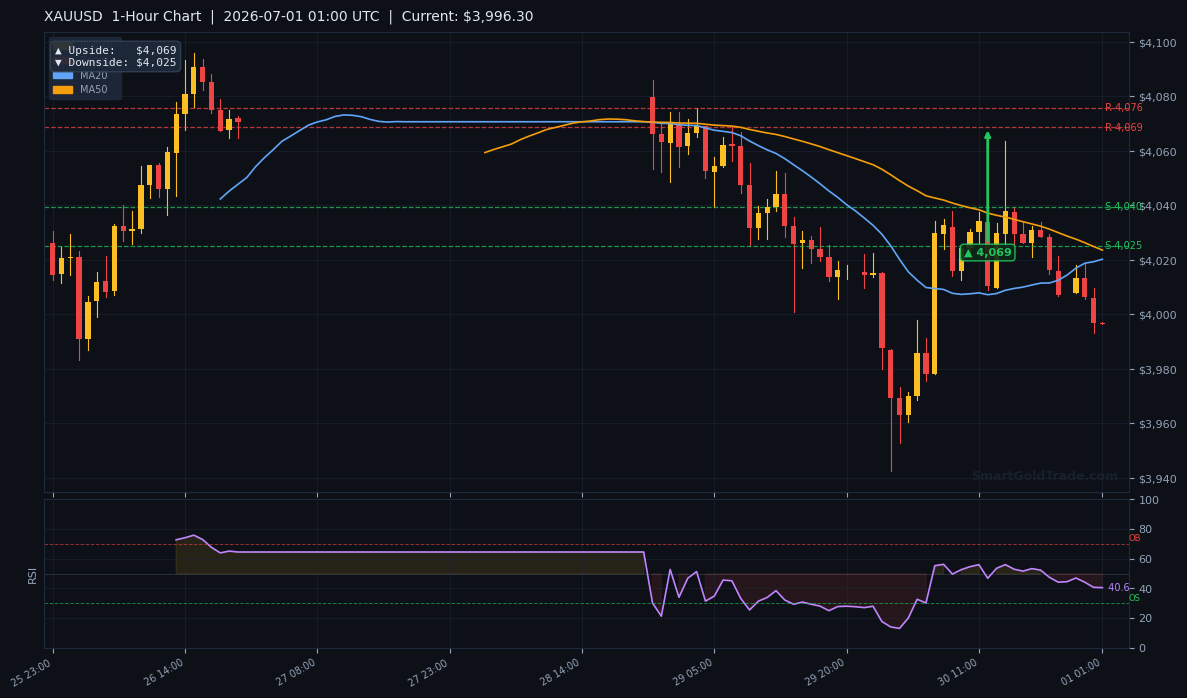
The 4-hour chart reveals a prior downswing exhaustion near $4,140, with an upside target of $4,139 and a downside target of $4,140—effectively marking a consolidation pivot. On the 1-hour timeframe, the immediate resistance is $4,069 while support sits at $4,025. These levels define the tactical boundaries for today’s trade.
| Timeframe | Upside Target | Downside Target |
|---|---|---|
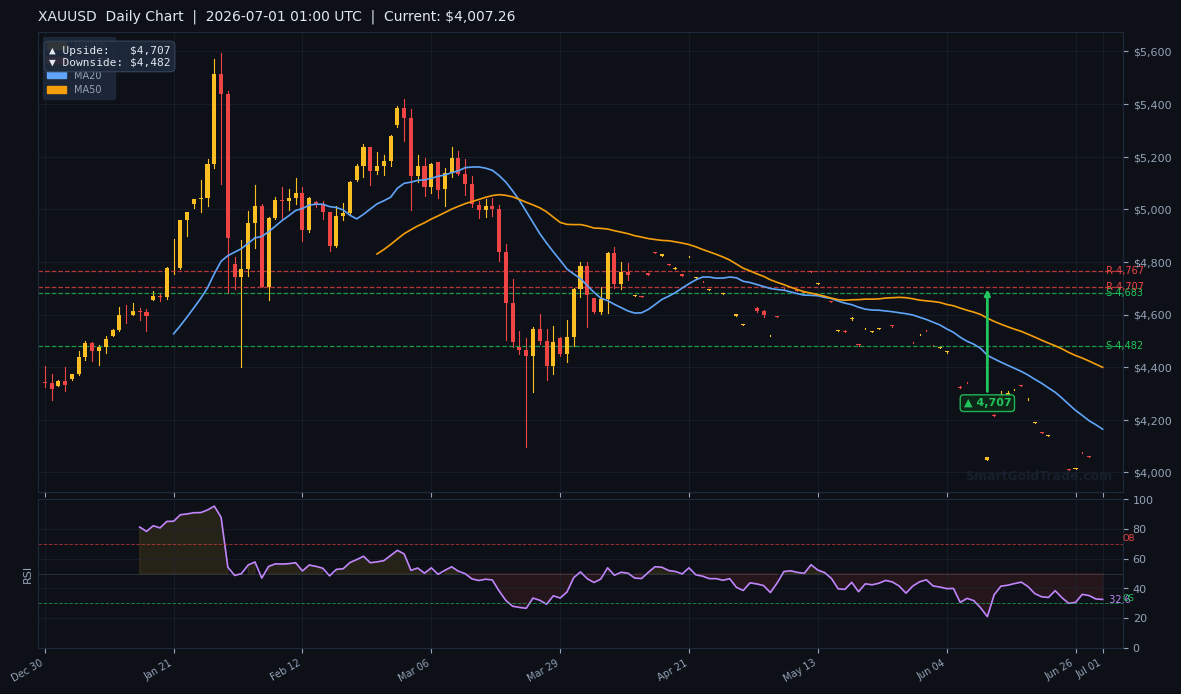
| Daily | $4,707 | $4,482 |
| 4-Hour | $4,139 | $4,140 |
| 1-Hour | $4,069 | $4,025 |
Fundamental Drivers
Last week’s UK BRC Shop Price Index reading of 1.2% (versus a 1.3% consensus) is more than a footnote. It underscores the disinflationary wave hitting developed markets, which in turn pressures the Bank of England and other central banks toward earlier rate cuts. For gold, the takeaway is clear: if yields begin to drift lower globally, the opportunity cost of holding bullion shrinks, offering a tailwind even in a hawkish Fed environment. The immediate negative correlation with the DXY remains intact; a dollar that cannot break above 104.0 invites gold bids on dips.
Key Event to Watch
This Friday’s US Nonfarm Payrolls report (July 03) will dominate the week. A payroll number below 180,000 would likely send gold charging towards $4,100 and beyond, while a strong print above 220,000 could push the metal below $3,960. Ahead of the release, position sizing must account for that event risk—no trade should be exposed without a stop-loss.
Devil’s Advocate
The primary risk to the long setup is that the bearish structure reasserts itself before the NFP catalyst. If gold slides beneath $3,980 and holds below that level into the London fix, the bounce thesis evaporates. In that scenario, the next leg down targets $3,960 and possibly $3,900, aligning with the daily downside target of $4,482 (longer-term). A daily close above $4,035—the 20-period moving average—would invalidate the immediate bearish bias and flip the outlook to neutral-bullish, encouraging a reassessment.
Trading Strategy for Asian Session
The setup is a counter-trend long with strict risk management. The entry zone is $3,990–$3,980, ideally triggered by a bullish engulfing or hammer candle on the 15-minute chart. Place a stop loss at $3,960, which sits below the double bottom of the overnight range and provides a buffer of roughly 1.5× ATR from the lower entry. The first take-profit is $4,025, matching the 1-hour downside pivot, and the second is $4,069, the 1-hour upside target. If momentum accelerates, a trailing stop can capture an extension to the 4-hour target of $4,139. This gives a risk-reward ratio of roughly 1:2.7 on the first target alone.
Subscribers to professional gold trading signals can receive real-time alerts when these levels come into play. For those using a Shariah-compliant execution, our halal gold trading environment removes swap fees and leverage, keeping the trade clean.
Key Takeaways
- Gold price at $3,981 sits near a low-risk entry zone for an Asian session bounce.
- Key overhead resistance is at $4,025 and $4,069, with a major barrier at $4,182.
- Bearish structure below $4,035 (MA20) advises treating this as a tactical counter-trend trade.
- ATR of $16.34 suggests a stop loss at $3,960 respects normal daily volatility.
- Friday’s NFP will reset the directional bias—keep position sizes small ahead of the release.
- A break below $3,980 voids the setup and opens the door to $3,960 and $3,900.
What This Gold Price Setup Means for the Week
With gold price perched just below the $4,000 psychological barrier, every tick during the thin Asian session carries extra weight. The $3,980–$3,981 band has absorbed selling pressure twice in the last 24 hours, hinting that short-term buyers are willing to step in. If the gold price can hold this floor into the European open, a relief rally toward $4,025 and $4,069 becomes plausible. That scenario would tee up a neutral-to-bullish bias ahead of Friday’s nonfarm payrolls.
On the downside, a decisive hourly close beneath $3,980 would kick the gold price to $3,960 and possibly $3,900, aligning with the daily bearish structure. Traders should watch the DXY closely—if the dollar index fails to conquer 104.0, gold bids are likely to surface on dips. For those who want direct exposure without leverage, physical gold holdings provide a timeless hedge; you can purchase physical gold coins and bars from our store to balance short-term trading risk. As always, position sizing ahead of NFP is critical, because the gold price often gaps after a surprise payrolls print.
Conclusion
Despite the dominant bearish alignment, gold price around $3,981 offers a disciplined buyer a well-defined entry with limited downside and multiple upside targets. The thin Asian session demands patience—resist the urge to chase false spikes. If the $3,980–$3,990 zone holds, the bounce can reach $4,025 and $4,069, delivering a favorable risk-reward outcome. Stay nimble, respect the stop, and let the structure guide the trade.
Frequently Asked Questions
- Why is the gold price dropping below $4,000?
- The gold price broke below the psychological level as the US dollar firmed and longer-term moving averages exerted bearish pressure. The 4-hour chart shows price below the $4,035 MA20 and $4,077 MA50, confirming short-term weakness.
- What is the next support for gold after $3,980?
- Below $3,980, the next meaningful support is $3,960—a level that aligns with the lower boundary of the overnight range and a 1.5× ATR extension. A sustained break there exposes $3,900.
- Is $4,069 a realistic target today?
- Yes, given the current gold price of $3,981, $4,069 sits within a normal ATR-based range from the entry zone. If the bounce gains traction, this level can be reached during the European overlap.
Risk Disclaimer: Trading Gold (XAU/USD) carries significant risk of loss and is not suitable for all investors. This content is for informational purposes only and does not constitute financial advice. Always conduct your own research and trade responsibly.