
The gold price is currently trading at $4,541.97, right above the pivotal $4,532 support level as the American session unfolds on May 18. Rising Treasury yields and a firmer US Dollar continue to weigh on bullion, while technical indicators flash a bearish structure on the higher timeframes. Today's session will be decisive—a break below $4,532 could open the door toward $4,667, while a defence of that level might set up a short-term bounce toward $4,584 resistance. Traders should brace for increased volatility as liquidity tightens into the afternoon.
Gold Market Overview
Macro Context
The macro backdrop remains unfriendly for the gold price. The US Dollar Index (DXY) has climbed for a third consecutive session, underpinned by hawkish Fed commentary and rising 10-year real yields. Last week's PPI data came in hotter than expected, reinforcing the narrative that the Fed will hold rates steady for longer. Although the Federal Reserve maintained a neutral stance at its last meeting, the market is pricing in a 65% probability of a rate hold through Q3 2026. Higher yields increase the opportunity cost of holding non-yielding gold, and the chart reflects that selling pressure.
Session Outlook
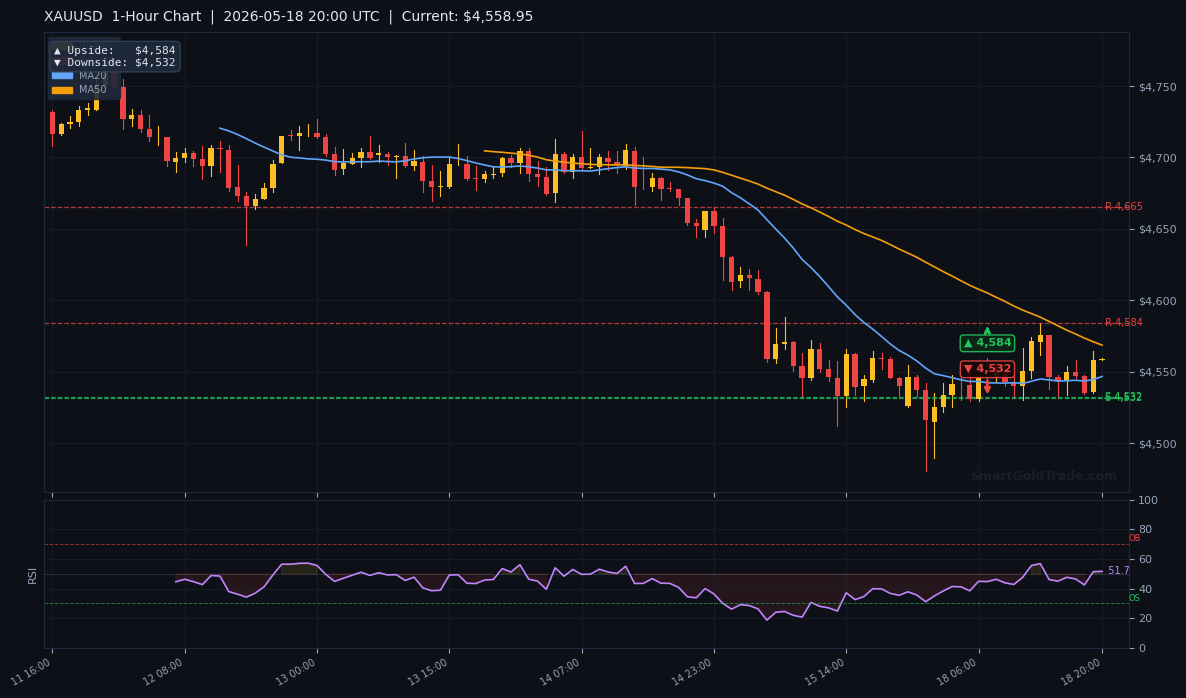
During the American session, liquidity typically drops after the European close, which can amplify moves. With no major economic releases scheduled for today, price action will be driven by technical levels and order flow. The $4,532 level is a 1-hour downside pivot target from our charts and coincides with a prior demand zone. A breach below could trigger a cascade of stop-losses, accelerating the move toward $4,667.
Technical Analysis
The daily chart shows the gold price trading below all three key moving averages—a classic bearish alignment. The short-term momentum is weak, but the RSI is drifting near oversold territory, which could attract value buyers.
Moving Average Structure
The MA20 at $4,610.70, the MA50 at $4,669.29, and the MA200 at $4,693.69 all sit above the current gold price. This descending order confirms a bearish trend across all timeframes. The EMA structure shows MA20 below MA50, reinforcing the short-term bearish pressure. Until the price reclaims the $4,610 level, any bounce should be treated as a selling opportunity.
RSI and Momentum
The RSI(14) reads 30.4, which sits right on the border of the neutral and oversold zones. This is a critical juncture: while the indicator signals bearish momentum, a reading below 30 would typically trigger a contrarian bounce. The ATR(14) of $14.89 suggests the daily expected range is moderate, but a break of the $4,532 support could easily extend beyond that due to low liquidity.
Key Price Levels
| Timeframe | Resistance | Support |
|---|---|---|
| Daily | $4,838 | $4,667 |
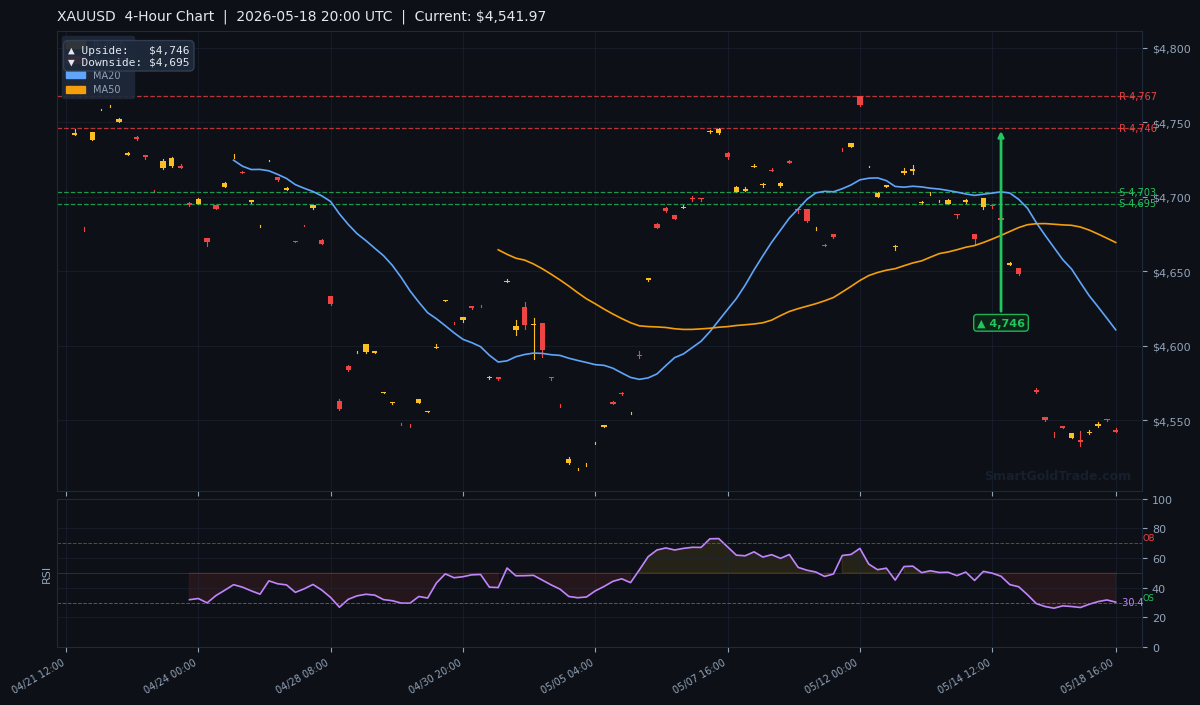
| 4-Hour | $4,746 | $4,695 |
| 1-Hour | $4,584 | $4,532 |
The 1-hour pivot arrows point to $4,584 as immediate resistance and $4,532 as immediate support. A break of $4,532 targets the 4-hour support zone near $4,695, though that level is well below current price. For the session, focus on the $4,532–$4,584 range.
Fundamental Drivers
The gold price is reacting to the persistent upward pressure in US Treasury yields. The 10-year yield hit a three-week high above 4.65% earlier today, driven by last week's hotter PPI and a hawkish remark from Fed Governor Waller. This yield move strengthens the dollar and makes gold less attractive. Additionally, safe-haven demand has faded as geopolitical tensions in Eastern Europe show signs of de-escalation, removing a supportive pillar for bullion.
Key Event to Watch
This week's main catalyst will be Wednesday's release of the FOMC Meeting Minutes from the May policy meeting. Traders will dissect the language for any shift in the rate path. If the minutes confirm a prolonged pause, the gold price could extend its decline toward $4,667. Conversely, any dovish nuance may trigger a relief rally toward $4,584.
Devil's Advocate
What if the $4,532 support holds? A failure to break lower in the face of bearish fundamentals could indicate that sellers are exhausted. The RSI at 30.4 already suggests the selling pressure is mature. If the gold price bounces from $4,532 and reclaims the $4,584 resistance on the 1-hour chart, that would invalidate the bearish bias. For the moment, the path of least resistance is down, but traders must respect the possibility of a false break.
Trading Strategy for American Session
Sell Zone: Look for a retest of the $4,558 – $4,567 area (current market price + small pullback) with a stop loss above $4,585, just above the 1-hour resistance. Take profit targets: first at $4,532, second at $4,510 (extended downside). For risk, use the ATR of $14.89 as a guide—set stop at 1.5x ATR, i.e., around $22 from entry. Alternatively, use a breakout strategy: sell on a confirmed 4-hour close below $4,532 with a target of $4,667. For Shariah-compliant traders, the halal gold trading platform offers riba-free spot trading without leverage. For those needing real-time alerts, consider professional gold trading signals to stay ahead of the move.
Key Takeaways
- The gold price is trading at $4,541.97, below all major moving averages (MA20: $4,610.70, MA50: $4,669.29, MA200: $4,693.69).
- RSI at 30.4 is neutral but approaching oversold—potential for a bounce if support holds.
- Immediate support at $4,532 (1-hour pivot); breakdown targets $4,667 (daily bottom arrow).
- Immediate resistance at $4,584 (1-hour pivot); recovery above opens path to $4,746 (4-hour resistance).
- ATR of $14.89 defines daily volatility—adjust stop-losses accordingly.
- FOMC minutes on Wednesday are the next macro event; a hawkish tone could accelerate downside.
Conclusion
The gold price is at a critical juncture during the American session. With the structure bearish and the RSI hovering at 30.4, the odds favour a test of $4,532 support. A breakdown could quickly extend losses to $4,667. However, the oversold condition means traders should remain alert for a sudden squeeze if the level holds. Watch the $4,584 resistance for a potential shift in momentum. Stay disciplined with stop-losses and manage position size in this low-liquidity environment.
Frequently Asked Questions
- What is the key support level for gold price today?
- The immediate support is $4,532, based on the 1-hour pivot arrow. A break below this could see gold testing the daily downside target of $4,667.
- Why is gold falling despite inflation concerns?
- Higher US Treasury yields and a stronger US Dollar are overriding inflation fears. When yields rise, gold's opportunity cost increases, prompting investors to sell.
- Is the RSI indicating gold is oversold?
- The RSI(14) is at 30.4, which is on the border of oversold territory (typically below 30). While it signals bearish momentum, it also suggests that a short-term bounce could be imminent.
- What is the best trading strategy for today's session?
- For bearish positioning, sell on a retest of $4,558 with a stop above $4,585 and target $4,532. For a breakout, sell below $4,532 aiming for $4,667. Always use a stop-loss based on ATR (~$15).
- How does the US Dollar affect gold price?
- There is a strong inverse correlation. As the DXY rises, gold becomes more expensive for foreign buyers, typically pressuring the price lower. The recent DXY strength is a key driver of today's pullback.
Trading Gold (XAU/USD) carries significant risk of loss and is not suitable for all investors. This content is for informational purposes only and does not constitute financial advice. Always conduct your own research and trade responsibly.