
The gold price opened the European session at $4,720.80, maintaining a firm bid above short-term moving averages. Last week’s softer US dollar and falling Treasury yields continue to underpin the rally, even as equities grind to fresh highs. With the RSI(14) sitting at 64.4, the metal still has room to run before hitting overbought territory. The key question for traders today: can bulls push through $4,746 resistance and open the door to $4,857?
Gold Market Overview
Macro Context
The US Dollar Index (DXY) is retesting support after a multi-day decline, reflecting reduced safe-haven demand for the greenback. US bond yields also slid, making non-yielding assets like gold more attractive. Wednesday’s ADP employment beat (stronger than expected) was overshadowed by worrying ISM Services data—prices paid surged while the employment subindex contracted. That cocktail keeps the Federal Reserve cautious but not hawkish, supporting the gold price medium-term.
Session Outlook
European hours bring higher liquidity and the first real test of the day’s levels. Expect choppy price action around $4,720–$4,724 as traders digest overnight moves. A break above $4,724.54 (R2 resistance) would confirm intraday bullish intent and target the 4-hour upside pivot of $4,746. On the flip side, a move below $4,702.94 (S1) could trigger a retest of $4,679.99 (S2).
Technical Analysis
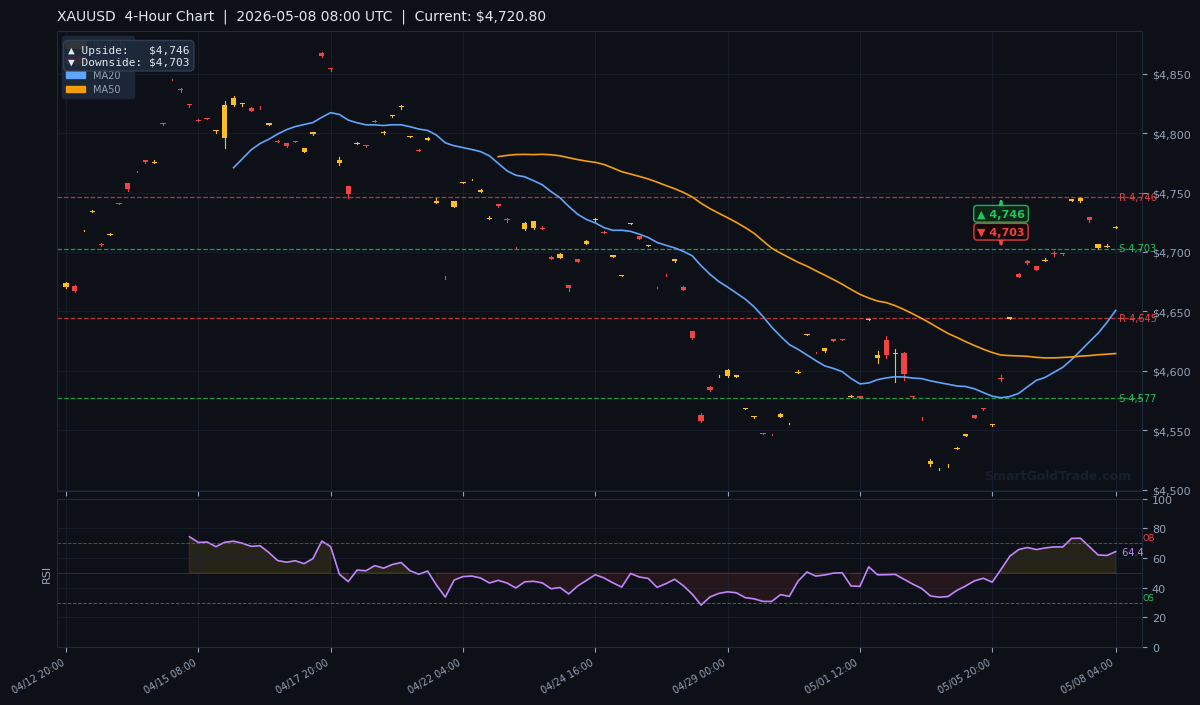
The technical picture is firmly bullish across multiple timeframes. The gold price is trading above all three key moving averages on the H4 chart, a classic setup for trend continuation.
Moving Average Structure
The MA20 at $4,650.88 sits above the MA50 at $4,614.62, confirming short-term bullish momentum. The MA200 at $4,665.95 is well below current price, affirming the long-term bull market is intact. Price accelerating away from these averages suggests strong buying pressure.
RSI and Momentum
The RSI(14) reads 64.4—firmly in neutral territory but leaning bullish. There is no divergence or overbought warning. This gives bulls room to push toward the $4,746 resistance without triggering a reversal signal. Daily momentum is building, supported by a rising ATR(14) of $20.29, indicating wider daily ranges are likely.
Key Price Levels
Resistance: R1 at $4,745.97, R2 at $4,724.54
Support: S1 at $4,702.94, S2 at $4,679.99
Based on the ATR(14) of $20.29, the European session could see a trading range of roughly $4,700–$4,741.
| Timeframe | Resistance | Support | Current Price |
|---|---|---|---|
| Daily | $4,857 | $4,667 | $4,720.80 |
| 4-Hour | $4,746 | $4,703 | $4,720.80 |
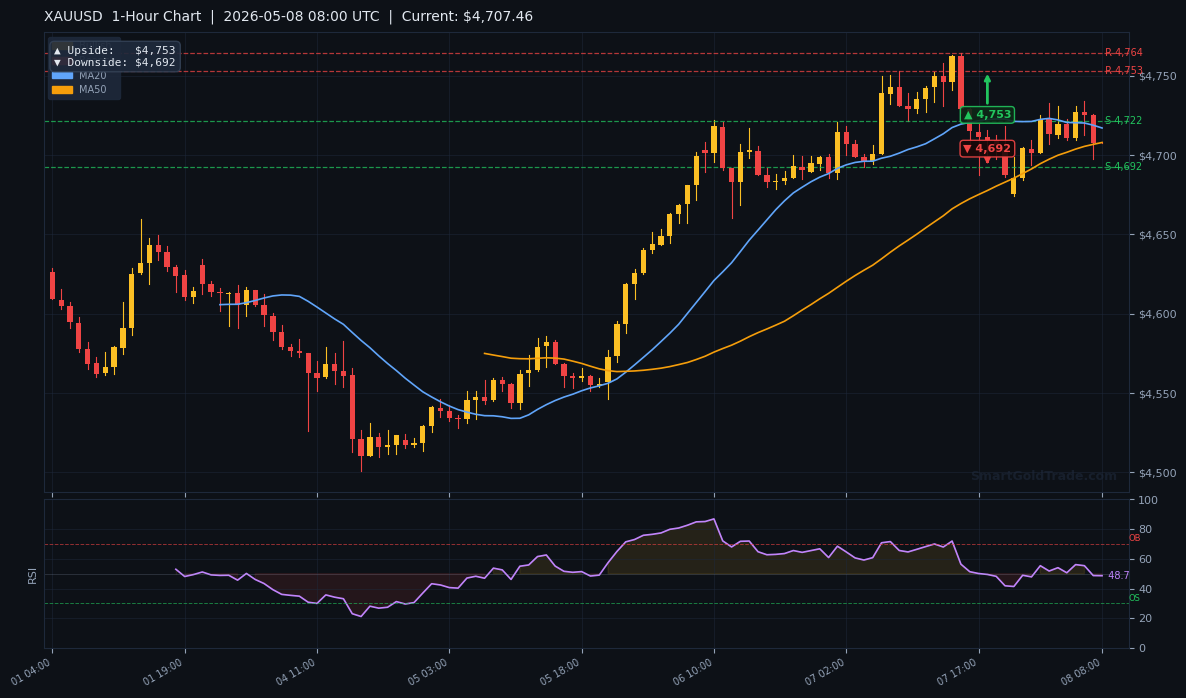
| 1-Hour | $4,753 | $4,692 | $4,720.80 |
Fundamental Drivers
The primary catalyst for the current gold price rally is the soft US dollar. MUFG analyst Lloyd Chan highlighted that DXY is testing support, while US yields continue to decline. The combination of weaker ISM Services employment data and higher prices-paid components suggests stagflationary pressures are creeping into the US economy. This historically favors gold as a hedge.
Key Event to Watch
While no major economic releases are due today, traders will keep a close eye on any Fed commentary during the European afternoon. A dovish lean could fuel a breakout above $4,746. Conversely, any hawkish pushback may cause a quick dip toward $4,703 support. The absence of fresh data puts technical levels in the driver’s seat.
Devil’s Advocate
What could derail the bullish gold price outlook? A sudden USD recovery—perhaps triggered by safe-haven buying on geopolitical headlines—would hit gold quickly. If DXY reclaims its 200-day moving average, gold could slide below $4,702.94 (S1). A break and close below $4,679.99 (S2) would flip the intraday structure bearish, targeting the 1-hour downside pivot of $4,692 and potentially $4,667. Bulls need to defend $4,703 to keep the momentum alive.
Trading Strategy for European Session
Entry Zone: Buy on a confirmed break above $4,724.54 (R2) with volume, or on a retest of $4,720–$4,715 support holding above S1.
Stop Loss: Place stops below $4,700 (just below S1) to allow for wiggle room—approximately 1 ATR worth of risk ($20).
Take Profit Targets: First target $4,746 (4-hour resistance). If that clears, target $4,753 (1-hour resistance) and eventually $4,857 (daily upside pivot). Consider taking partial profits at $4,746 and trailing stops.
For a bearish scenario, consider a short only if price closes below $4,702.94 with momentum. Then target $4,679.99 and $4,667. However, the bias remains bullish as long as price stays above the MA20.
For traders who prefer a hands-off approach, consider using copy trading to mirror expert gold traders who are already positioned for this breakout.
Key Takeaways
- Gold price is trading at $4,720.80, above all key moving averages, confirming bullish trend.
- RSI(14) at 64.4 shows room for further upside before overbought conditions.
- Key resistance at $4,724.54 (R2) and $4,746 (4-hour pivot) must break for continuation toward $4,857.
- Immediate support stands at $4,702.94 (S1) and $4,679.99 (S2).
- US dollar weakness and falling yields remain the primary fundamental drivers.
- Expected session range based on ATR(14) of $20.29: $4,700–$4,741.
Conclusion
The gold price is at a pivotal moment. With technicals bullish and fundamentals supportive, the path of least resistance is higher. The immediate hurdle is $4,724.54, but the bigger prize lies at $4,746. If bulls can break through with conviction, the daily target of $4,857 comes into play. Watch the US dollar and any central bank headlines for the final signal. European session volatility should offer clear entry points for disciplined traders.
Frequently Asked Questions
- What is the current gold price and where is it heading?
- The gold price is $4,720.80 during the European session. Technicals suggest a bullish bias with the next target at $4,746 resistance. A break above that could open the door to $4,857.
- What are the key support and resistance levels for gold today?
- Key supports are $4,702.94 (S1) and $4,679.99 (S2). Resistances are $4,724.54 (R2), $4,746 (4-hour pivot), and $4,857 (daily pivot).
- Is gold overbought or still bullish?
- The RSI(14) is at 64.4, which is neutral and not overbought. This indicates the trend still has momentum without signalling a reversal. Conditions become overbought above 70.
- How does the US dollar affect gold price today?
- The US dollar index (DXY) is retesting support, and US yields are falling. A weaker dollar typically pushes gold prices higher. If DXY rebounds, gold could test supports at $4,703 or $4,680.
Trading Gold (XAU/USD) carries significant risk of loss and is not suitable for all investors. This content is for informational purposes only and does not constitute financial advice. Always conduct your own research and trade responsibly.