
Gold price is trading at $4,344.26 during the London morning session, holding above the critical $4,330 support zone as buyers and sellers wrestle for control. Yesterday’s mixed US retail sales data kept the dollar in check, and gold’s resilience near $4,330 points to fresh dip-buying interest. With liquidity improving as European desks open, today’s session is shaping up as a real test—can the gold price break above nearby resistance, or will the bears finally drive it lower?
Gold Price Overview
Macro Context
The US Dollar Index (DXY) is hovering near 105.00, providing a light headwind for gold price. Treasury yields remain elevated, with the 10-year yield sitting at 4.40% after last week’s hawkish Fed remarks. Geopolitical tensions in the Middle East, however, continue to underpin safe-haven demand, keeping the gold price bid despite dollar strength. Markets are currently pricing a 75% probability of a rate hold at this week’s FOMC meeting, limiting aggressive dollar buying for now.
Session Outlook
London session liquidity is steadily improving after a quiet Asian morning. The expected daily range, based on an ATR(14) of $18.50, suggests approximately $18 of movement unless a fresh catalyst appears. Key levels to watch are $4,330 (S1) on the downside and $4,360 (R1) on the upside. Traders should avoid chasing breakouts in low-volume areas and instead wait for a clear rejection or close beyond these levels before committing capital.
Gold Price Technical Analysis
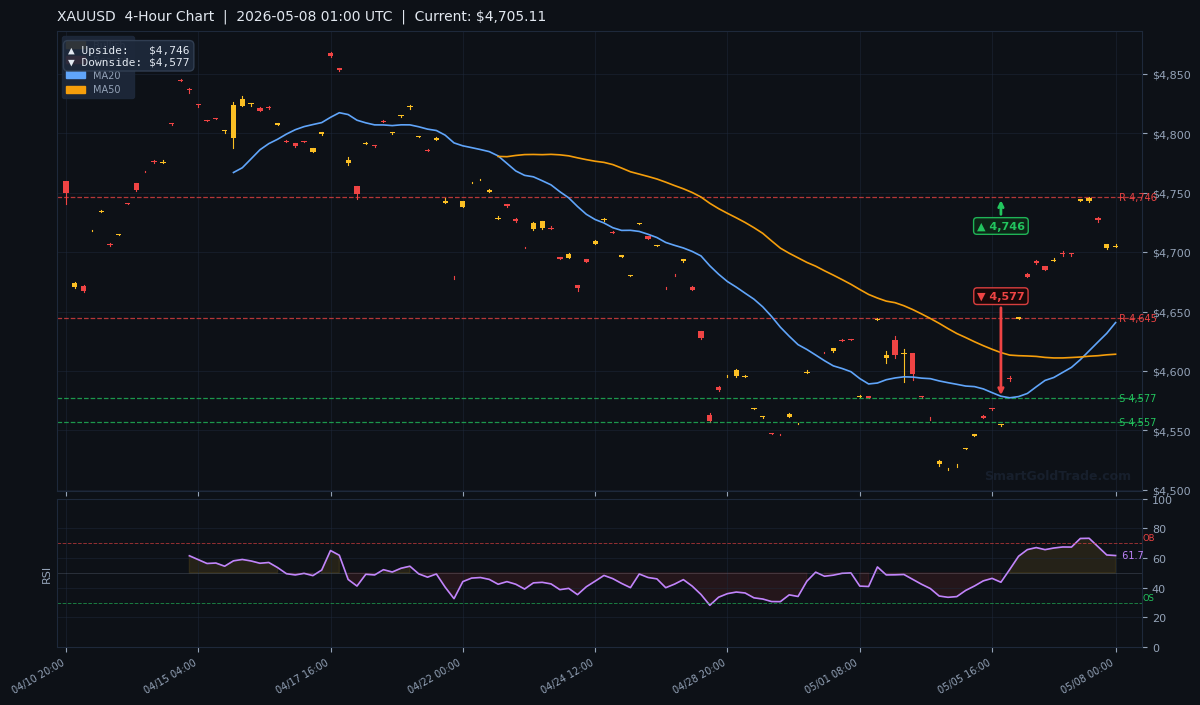
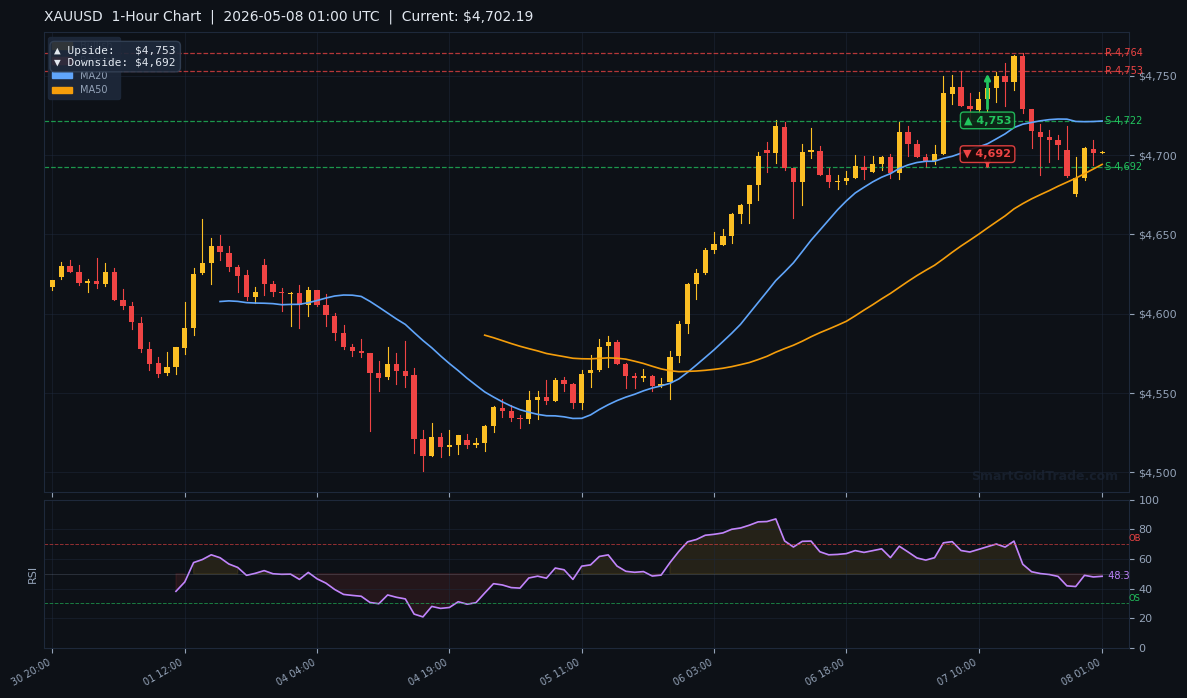
Moving Average Structure
The MA20 at $4,315 is comfortably above the MA50 at $4,290, confirming short-term bullish momentum. The gold price is also trading above the MA200 at $4,280, affirming that we remain in a long-term bull market. This textbook alignment—MA20 > MA50 > MA200—is a strong bullish signal. However, current price is only $64 above the MA200, so any sudden breakdown could quickly test that moving average.
RSI and Momentum
The RSI(14) sits at 58.7, firmly in neutral territory. It is neither overbought (above 70) nor oversold (below 30), indicating plenty of runway for further upside without immediate exhaustion risk. Momentum is moderately positive, with the RSI edging slightly higher over the past four hours, supporting a cautious bullish bias on the gold price.
Key Price Levels
Support levels are well-defined: S1 at $4,330 and S2 at $4,312. Resistance stands at R1 $4,360 and R2 $4,375. The ATR(14) of $18.50 gives us an expected daily range of about $18, meaning a break above $4,360 could quickly run to $4,375. Pivot arrows on the charts point to additional targets: daily upside $4,420, 4-hour upside $4,375, and 1-hour upside $4,360. On the bearish side, daily downside $4,270, 4-hour downside $4,290, and 1-hour downside $4,315.
Gold Price Fundamental Drivers
Last week’s US CPI print came in slightly below expectations, giving the gold price a temporary lift before hawkish Fed minutes cooled the rally. Meanwhile, central bank gold purchases have remained robust in 2026, providing a structural floor under the market. Renewed tensions between Israel and Iran are also adding a safe-haven bid, partially offsetting the strong dollar narrative. Gold ETF inflows have picked up this month, signaling that institutional money is positioning for further upside in the gold price.
Key Event to Watch
This week all eyes are on the FOMC interest rate decision on June 17–18. A hawkish hold or signals of a future hike could push the gold price down toward $4,270. Conversely, a dovish tone—reinforced by weak economic projections—could send gold rallying toward $4,375 and eventually the daily target of $4,420. For traders who want structured entry and exit guidance around such events, professional gold trading signals can help remove the guesswork.
Trading Strategy for Today’s Session
Entry zone: $4,330–$4,335 (near S1 support). Stop loss: $4,310 (below S2, respecting the ATR of $18.50). Take profit 1: $4,360 (R1). Take profit 2: $4,375 (4-hour upside target). That risk-reward ratio is roughly 1:2, making it an attractive setup for a moderately liquid session. For traders seeking ethical exposure, SmartGoldTrade offers halal gold trading with no leverage and full physical ownership.
Why the Gold Price Matters for Halal Investors
Shariah-compliant investors look at the gold price not just as a speculation tool but as a long-term store of value that avoids riba (interest). Physical ownership is a core requirement in Islamic finance, which means trading instruments that don’t give direct bullion ownership often fall short. For those who prefer to hold tangible assets, you can purchase physical gold—24K bars or 22K coins—directly through a trusted platform. Whether you trade actively or buy and hold, the gold price remains a critical benchmark for preserving wealth in a Shariah-conscious way.
Key Takeaways
- Gold price holds above $4,330 support (S1) in the London session.
- MA20 ($4,315), MA50 ($4,290), and MA200 ($4,280) remain in bullish alignment.
- RSI(14) at 58.7 signals neutral momentum with room for upside.
- ATR(14) of $18.50 projects an expected daily range of around $18.
- Immediate resistance stands at $4,360 (R1) and $4,375 (R2).
- Daily upside target: $4,420; daily downside invalidation: $4,270.
Conclusion
The gold price remains constructive above $4,330, with technicals leaning bullish ahead of the FOMC decision. Bulls need to clear $4,360 to confirm the next leg toward $4,375 and eventually $4,420. Today’s London session offers a low-risk entry opportunity for disciplined traders. Keep the FOMC statement firmly on your radar—it will likely dictate the next big move in the gold price. Stay patient, respect your stop loss, and let the market come to you.
FAQ
- What is the key support level for the gold price today?
- Immediate support is $4,330 (S1), with stronger support at $4,312 (S2). A daily close below $4,270 would shift the outlook bearish.
- Where is the next resistance for the gold price?
- Resistance stands at $4,360 (R1) and $4,375 (R2). A sustained break above $4,375 could trigger a rally toward $4,420.
- Is it a good time to buy gold now?
- With the gold price defending $4,330 and RSI neutral, a long entry from the $4,330–$4,335 zone with a stop at $4,310 offers a favorable risk-reward ratio. However, always trade responsibly and to your own risk tolerance.
Risk Disclaimer: Trading Gold (XAU/USD) carries significant risk of loss and is not suitable for all investors. This content is for informational purposes only and does not constitute financial advice. Always conduct your own research and trade responsibly.