
Gold price is currently trading at $4,688.26 per troy ounce as the Asian session opens on May 7, 2026. The market is in a quiet consolidation phase after last week's bullish rally, with thin liquidity demanding patience from traders. China's Services PMI for April came in at 52.6 (up from 52.1), signaling continued expansion in the services sector and offering mild support to risk sentiment. However, gold's reaction has been muted so far. Today's forecast revolves around two key levels: a bullish breakout above $4,728 or a bearish breakdown below $4,669.
Gold Market Overview
Macro Context
The U.S. Dollar Index (DXY) remains steady near 104.50, capping any aggressive upside in gold during the Asian session. Treasury yields are slightly higher, with the 10-year note at 4.42%, offering a headwind for the non-yielding metal. The Federal Reserve's recent stance — hawkish hold on rates — continues to weigh on gold's medium-term bullish narrative. However, geopolitical uncertainties (lingering tensions in the Middle East and trade frictions) provide a floor under the gold price. The market is pricing in a 70% chance of a rate cut in September, but no immediate catalyst.
Session Outlook
Asian session liquidity is thin, with most participants waiting for European and U.S. opens. Expect the gold price to trade in a $4,669–$4,728 range, with the midpoint near $4,688. The low volatility (ATR of $17.61 suggests a daily range of about $17) means breakouts may lack follow-through. Patience is key — do not chase moves in low volume.
Technical Analysis
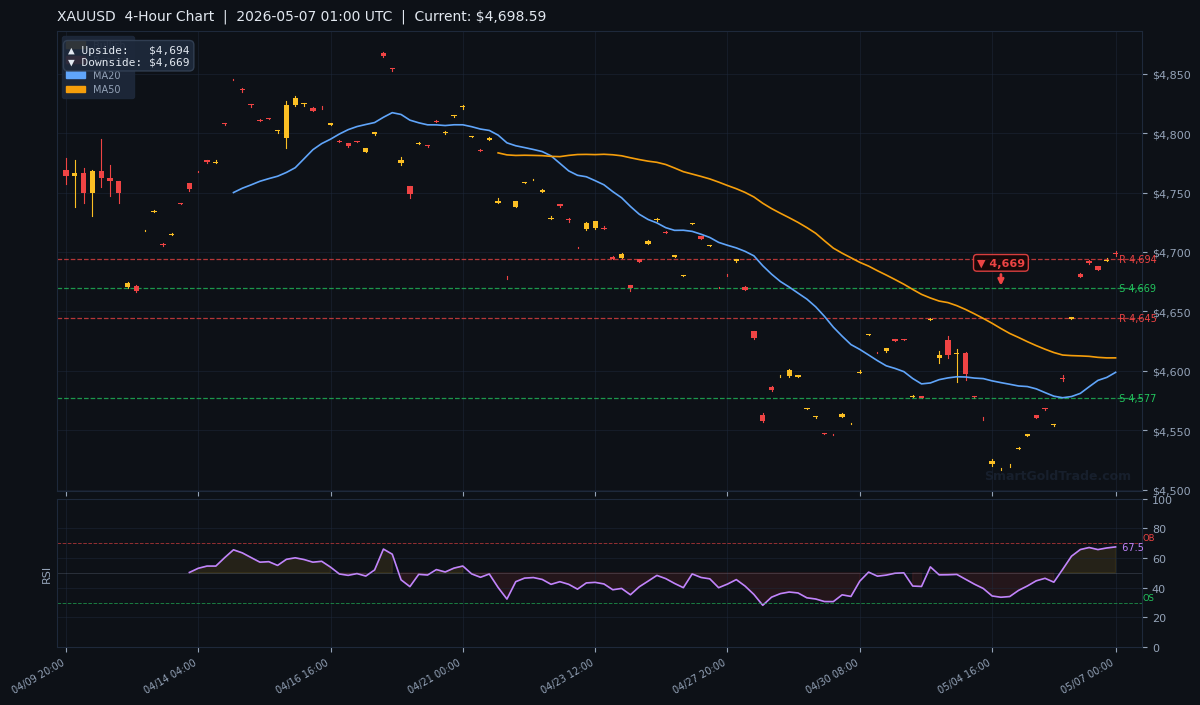
The live H4 chart for XAUUSD shows the gold price at $4,698.59 (slightly above the reported spot price due to intraday fluctuations). All key moving averages are aligned bullishly: MA20 at $4,598.80, MA50 at $4,610.98, and MA200 at $4,653.73. Price is above all, confirming a long-term uptrend. However, the EMA structure shows MA20 below MA50 — short-term bearish pressure that could cap runaway rallies.
Moving Average Structure
The MA20 ($4,598.80) and MA50 ($4,610.98) are both well below the current price, indicating strong short- and mid-term bullish momentum. The MA200 ($4,653.73) acts as the ultimate bull market floor. Any pullback toward $4,669 (S2 support) would still keep price above all three moving averages, maintaining the bullish structure.
RSI and Momentum
The RSI(14) reads 67.5 — firmly in neutral territory (not overbought). This leaves room for further upside before hitting overbought conditions (above 70). Momentum is positive but not extreme, suggesting a gradual climb rather than a parabolic move.
Key Price Levels
| Timeframe | Upside Target | Downside Target |
|---|---|---|
| Daily | $4,857 | $4,667 |
| 4-Hour | $4,694 | $4,669 |
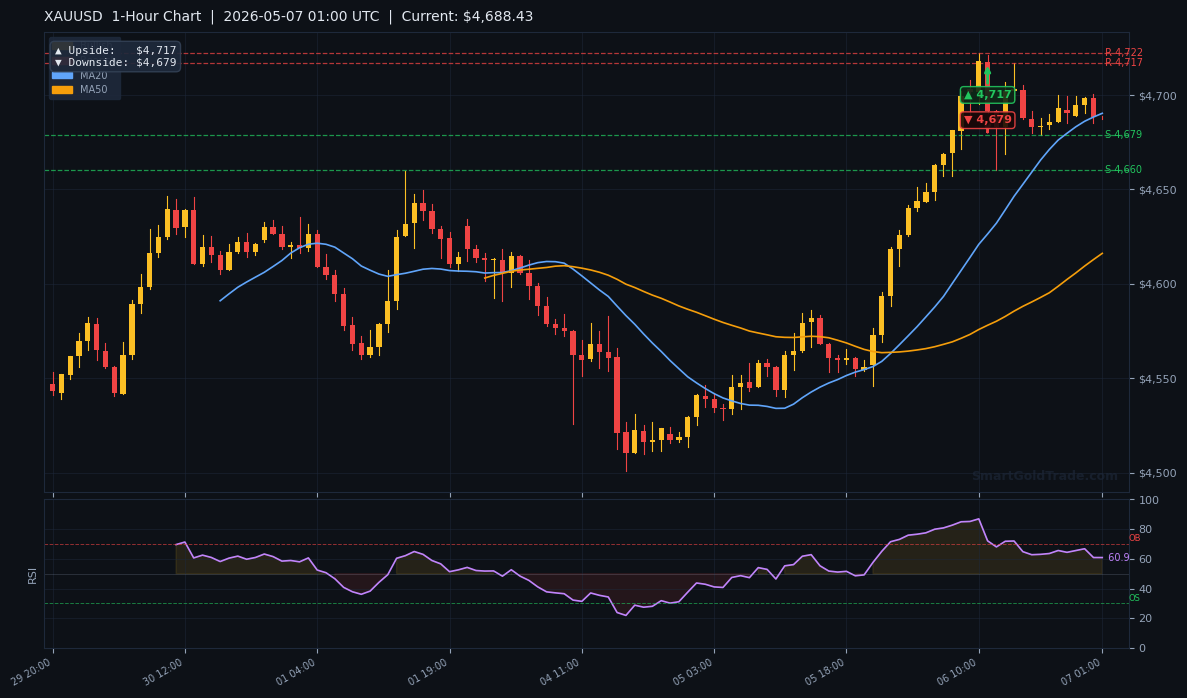
| 1-Hour | $4,717 | $4,679 |
The ATR(14) of $17.61 implies a typical daily range. Support levels to watch: S1 at $4,679.99 (immediate) and S2 at $4,669.34 (strong). Resistance: R1 at $4,728.36 and R2 at $4,724.54 (note R2 is slightly below R1 — a tight resistance zone meaning rejection could be sharp).
Fundamental Drivers
Yesterday's release of China's Services PMI for April — rising to 52.6 from 52.1 — signals that the world's second-largest economy is maintaining momentum in services. This supports risk appetite and marginally weighs on gold as a safe haven. However, the impact is muted during Asian hours. The bigger picture for gold price remains tied to the U.S. dollar and Fed policy expectations.
Geopolitical risks persist: ongoing tensions in the Middle East and trade disputes between the U.S. and China provide a constant floor. The gold price has a strong negative correlation with the DXY (currently -0.85 over 30 days). A break below 104 on the dollar could propel gold toward $4,728 quickly.
Key Event to Watch
Later this week, U.S. Initial Jobless Claims (tomorrow) and the University of Michigan Consumer Sentiment (Friday) will be closely watched. A weaker consumer sentiment print could reignite rate cut bets and lift gold price toward the $4,728–$4,857 zone. For now, markets are in a wait-and-see mode.
Devil's Advocate
The main bullish bias could be invalidated if gold price loses the $4,669 support (S2 on the 4-hour chart). A daily close below that level would break the MA200 ($4,653.73) and signal a potential trend reversal. The catalyst could be a sudden dollar strength from hawkish Fed speak or a risk-on surge that rotates capital out of gold. Watch the $4,679 hourly support as the first warning line.
Trading Strategy for Asian Session
With low liquidity, the best approach is to wait for a test of established levels. Consider these setups:
- Bullish scenario: Buy on a dip to $4,679–$4,669 zone with a stop loss at $4,655 (below MA200 and 0.5 ATR). Target $4,728 and then $4,857. Risk-reward: 1:3.
- Bearish scenario: Sell only if price fails at $4,728 resistance and forms a bearish engulfing pattern on the 1-hour chart. Stop loss at $4,742, target $4,679 then $4,669. Risk-reward: 1:2.
No trade is better than a forced trade. Use limit orders, not market orders, to avoid slippage in thin conditions. For those seeking a hands-off approach, halal gold trading on SmartGoldTrade allows spot trading without leverage or interest.
Key Takeaways
- Gold price at $4,688.26 — trading above all major moving averages (bullish).
- Key resistance at $4,728; a break could open the door to $4,857 (daily target).
- Critical support at $4,669; losing it would turn the trend bearish.
- ATR of $17.61 suggests a quiet session — avoid chasing breakouts.
- China Services PMI at 52.6 supports risk appetite but not enough to move gold significantly.
- Fed rate cut expectations (70% chance in September) remain the key fundamental driver.
The Bottom Line
The gold price is in a technical uptrend but faces immediate resistance at $4,728. The Asian session offers an opportunity to position for a breakout or a rejection, depending on how price interacts with the $4,679–$4,669 support zone. Bulls need to hold above $4,669 to maintain the upward bias; a close above $4,728 would confirm the next leg higher. Patience and disciplined risk management will separate successful traders from those caught in noise.
Frequently Asked Questions
- What is the gold price today?
- As of the Asian session open on May 7, 2026, gold (XAU/USD) is trading at $4,688.26. Intraday charts show a slightly higher level near $4,698.
- What are the key support and resistance levels for gold?
- Immediate support is $4,679 (S1), with stronger support at $4,669 (S2). Resistance is $4,728 (R1), followed by $4,857 on the daily chart.
- Is gold bullish or bearish today?
- The bias is cautiously bullish because price is above all major moving averages (MA20, MA50, MA200). However, the EMAs show short-term bearish pressure, so a pullback to the $4,679–$4,669 support zone is possible before the next leg up.
- What economic data is moving gold price this week?
- U.S. Initial Jobless Claims (Thursday) and Michigan Consumer Sentiment (Friday) are the key events. A soft consumer sentiment reading could boost gold. The China Services PMI (already released) had limited impact.
Trading Gold (XAU/USD) carries significant risk of loss and is not suitable for all investors. This content is for informational purposes only and does not constitute financial advice. Always conduct your own research and trade responsibly.