
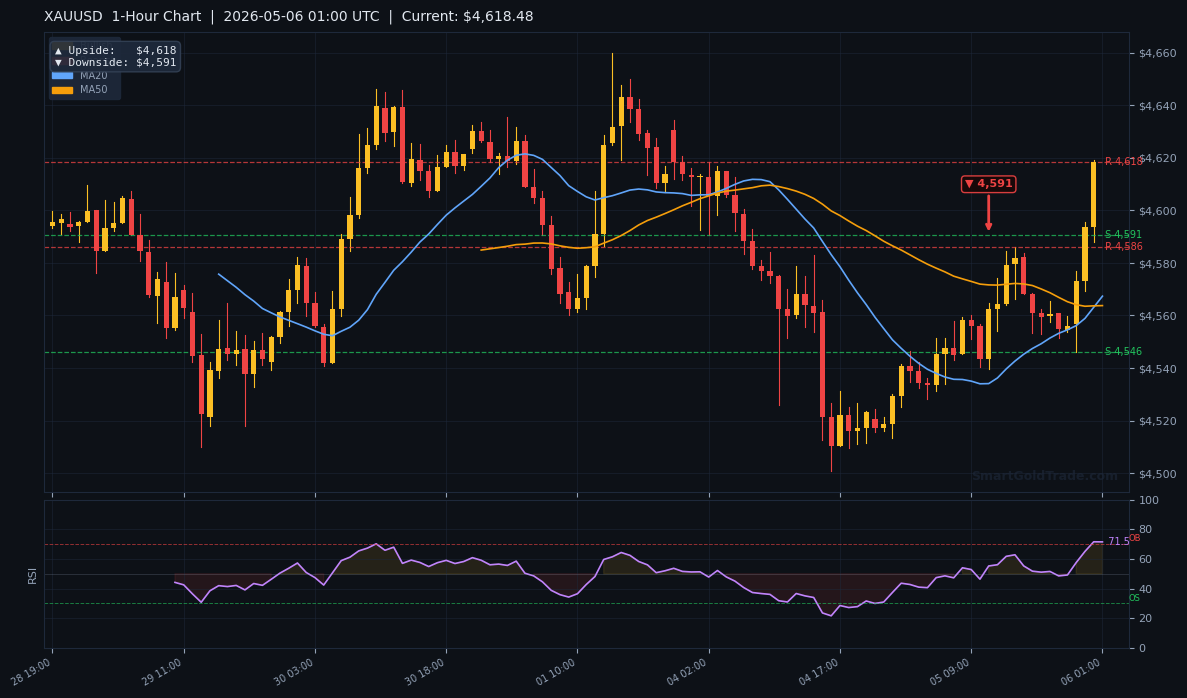
The gold price opens the Asian session on Tuesday at $4,618.28, holding above the prior day's close as traders digest mixed technical signals. Thin liquidity in early Asian hours keeps the metal within a narrow $7 range, with the 1‑hour chart showing an intraday upside target of $4,618 and downside risk at $4,591. Yesterday's modest uptick in WTI crude — now retreating to $101.80 — did little to shift sentiment, leaving the focus squarely on chart levels. This session, patience will reward those who wait for a confirmed break of the $4,618–$4,591 zone before committing capital.
Gold Market Overview
Macro Context
The DXY index edged higher overnight, putting mild pressure on the gold price. Meanwhile, US Treasury yields remain anchored near 4.35% as markets price in a 78% probability that the Fed holds rates steady at the June meeting. Geopolitical headlines out of the Middle East have quietened, reducing safe‑haven buying. The net effect is a market that lacks a strong catalyst, making technicals the primary guide for intraday moves.
Session Outlook
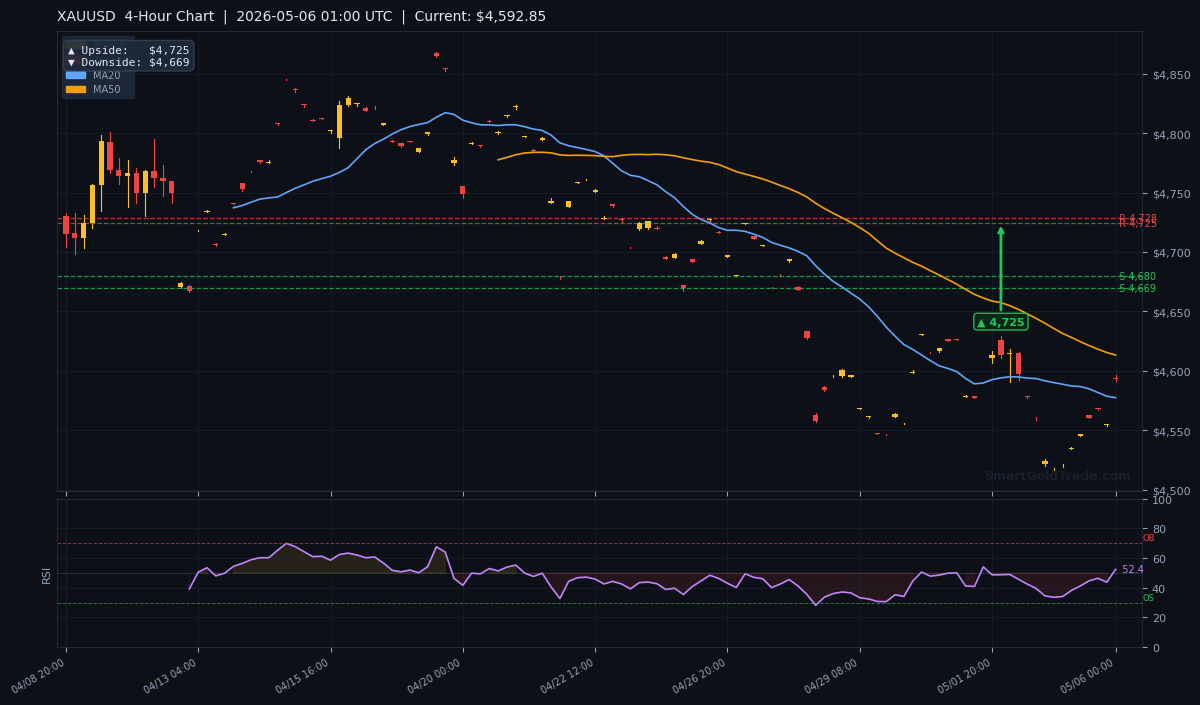
Asian session liquidity typically thins after the Tokyo lunch, and today is no exception. Expect the gold price to oscillate between $4,591 (1‑hour downside pivot) and $4,618 (1‑hour upside pivot) before key European flow arrives. A break above $4,618 would open the path toward the 4‑hour resistance at $4,725, while a drop below $4,591 could trigger a test of the daily downside target at $4,667.
Technical Analysis
Moving Average Structure
The H4 chart reveals a bearish short‑term structure: the MA20 sits at $4,577.46 and the MA50 at $4,613.36. The gold price currently trades above the MA20 but below the MA50, confirming that bulls have regained near‑term control but face stiff resistance from the medium‑term trend. The MA200 at $4,651.55 marks the broader bear territory — a close above this level would signal a major trend shift.
RSI and Momentum
The RSI(14) stands at 52.4, squarely in neutral territory. This reading suggests neither overbought nor oversold conditions, leaving room for movement in either direction. Momentum oscillators are flat, confirming the low‑volatility environment typical of Asian hours.
Key Price Levels
Support levels are clustered tightly: S1 at $4,703.05 (D1) and S2 at $4,679.99 (D1). On the upside, R1 at $4,728.36 and R2 at $4,726.40 (notable overlap) cap advances. The ATR(14) of $19.10 implies a daily range of roughly $4,599–$4,637 from current levels, well within the established support‑resistance boundaries.
Fundamental Drivers
The only notable development from the source material is the continued weakness in WTI crude oil, which slipped to $101.80 per barrel during Asian hours. Lower energy prices ease inflation expectations, reducing the urgency for central bank tightening — a slightly dovish factor that supports the gold price. However, the impact is muted because crude remains elevated historically.
Key Event to Watch
No major US data releases are scheduled for today. The next high‑impact event is Thursday's weekly jobless claims, but the real focus for gold traders is next week's US CPI report (May 13). Markets will watch any Fed commentary for hints on the rate trajectory. Until then, technicals lead.
Devil's Advocate
The primary risk to the bullish bias is a sustained break below the 1‑hour downside target of $4,591. If that level gives way, the gold price could slide rapidly toward the 4‑hour downside target of $4,669 and the daily low at $4,667. Such a move would be driven by stop‑loss cascades in the thin afternoon liquidity. Bulls must defend $4,591 to keep the uptrend intact.
Trading Strategy for Asian Session
Given neutral RSI and tight ranges, the best approach is to wait for a confirmed breakout. Entry zone: Buy on a retest of $4,600–$4,605 with a stop loss at $4,585 (below 1‑hour support). Take profit 1: $4,618 (1‑hour upside target). Take profit 2: $4,669 (4‑hour downside target, but used as upside target once $4,618 clears). Alternatively, sell on a break below $4,591 targeting $4,569 (20‑point loss) with a stop at $4,605. For those seeking a riba‑free approach, consider halal gold trading on our platform.
Key Takeaways
- Gold price at $4,618.28 sits between MA20 ($4,577) and MA50 ($4,613) — neutral short‑term.
- RSI at 52.4 leaves room for both upside and downside moves.
- Immediate resistance at 1‑hour target $4,618; 4‑hour resistance at $4,725.
- Key support at 1‑hour target $4,591; daily downside target at $4,667.
- ATR of $19.10 suggests today's range may be $4,599–$4,637.
- No high‑impact news today — technicals will drive price action.
Conclusion
The gold price enters the Asian session with a mild bullish bias, supported by a move above the MA20 and neutral momentum. Bulls need to clear the $4,618 level to target the 4‑hour resistance at $4,725, while bears look for a break below $4,591 to accelerate selling. The lack of economic data keeps the focus squarely on chart levels. For real‑time alerts, traders may benefit from professional gold trading signals. Trade with discipline and respect the low‑liquidity conditions.
Frequently Asked Questions
- What is the current gold price?
- The gold price is trading at $4,618.28 as of 01:00 UTC on May 6, 2026.
- What are the key resistance levels for gold today?
- Resistance sits at $4,618 (1‑hour), $4,725 (4‑hour), and $4,857 (daily).
- What is the main support level to watch?
- Immediate support is at $4,591 (1‑hour), followed by $4,667 (daily) and $4,669 (4‑hour).
- Is gold in a bull or bear trend?
- The trend is mixed: price is above MA20 (bullish short‑term) but below MA50 and MA200 (bearish medium‑to‑long term).
- What should traders watch in the Asian session?
- Focus on the $4,618–$4,591 range. A break above or below with volume will set the tone for European trading.
Trading Gold (XAU/USD) carries significant risk of loss and is not suitable for all investors. This content is for informational purposes only and does not constitute financial advice. Always conduct your own research and trade responsibly.