
The gold price held near $4,567 per ounce during Tuesday’s American session, down sharply from last week’s highs, as safe-haven demand for the US Dollar intensified following fresh Middle East hostilities. Reports of an alleged attack on a US military ship—denied by Washington—rattled markets early in the week, pushing the Dollar Index to 98.40 and weighing on bullion. With no major US economic data due today, traders are now laser-focused on geopolitical headlines and the technical breakdown below key moving averages. This session’s price action will determine whether $4,567 holds as support or gives way to deeper losses.
Gold Market Overview
Macro Context
The US Dollar Index (DXY) is holding a firm tone near 98.40, supported by risk aversion. Middle East tensions—specifically the unconfirmed attack narrative—have triggered a flight to the greenback, historically a headwind for gold. US Treasury yields remain subdued, with the 10-year hovering around 3.18%, offering no support for the non-yielding metal. The Federal Reserve’s next decision is weeks away, but markets already price in a 25-bps cut in June; for now, liquidity conditions are tight.
Session Outlook
During the American session, gold tends to see increased volatility as institutional flows enter the market. With DXY elevated and no Tier-1 data on the calendar, geopolitical headlines will be the primary catalyst. The gold price has already broken below the 4-hour MA20 at $4,581.79, and bears are now testing the psychological $4,550 zone. A break below $4,550 could accelerate selling toward the daily pivot support at $4,667.
Technical Analysis
Moving Average Structure
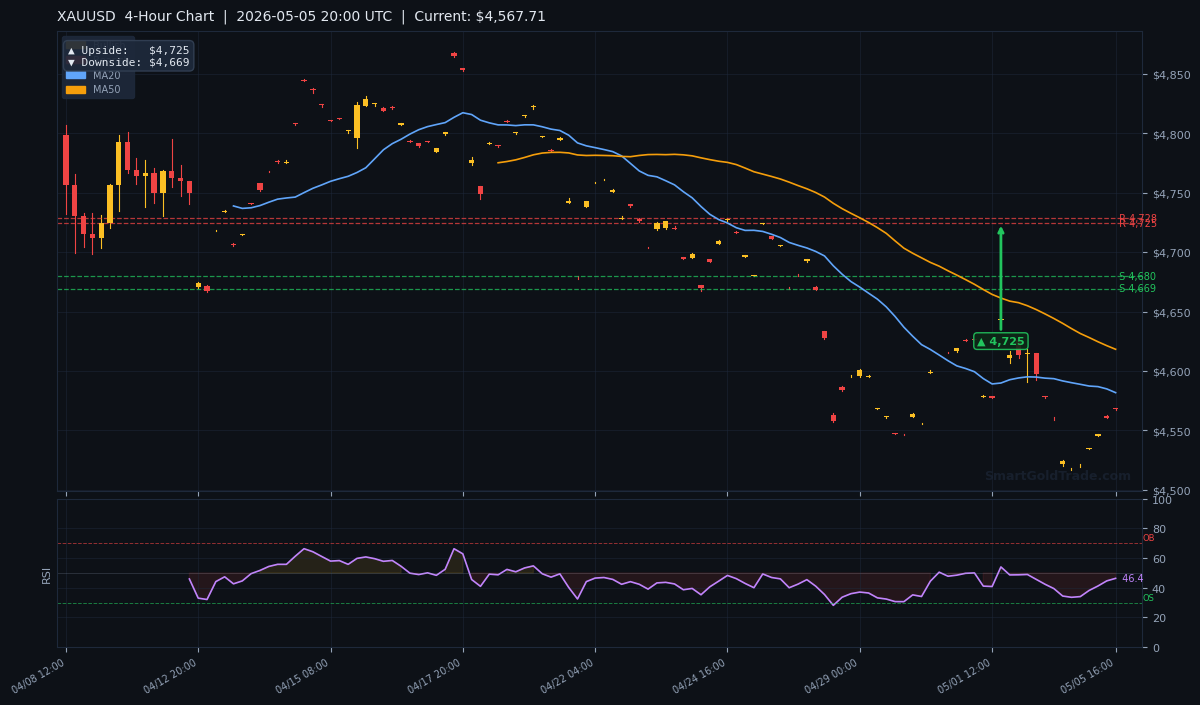
On the 4-hour chart, the MA20 sits at $4,581.79, the MA50 at $4,618.26, and the MA200 at $4,652.25. The gold price is currently trading below all three, confirming a clear short-to-medium-term bearish structure. The EMA alignment (MA20 below MA50) reinforces the downtrend. As long as price remains below $4,581.79, every rally into the moving averages will attract sellers.
RSI and Momentum
The RSI(14) reads 46.4, which is neutral—not oversold. This suggests there is room for further downside before bulls step in aggressively. Reaching 30–35 would indicate exhaustion, but for now, momentum is tilted to the downside. Traders should watch for any divergence if price makes a new low while RSI holds above 40.
Key Price Levels
Support S1: $4,703.05 (old support turned resistance?)
Support S2: $4,679.99
Resistance R1: $4,728.36
Resistance R2: $4,726.40 (note: R1 and R2 are very close).
The ATR(14) of $22.60 implies a normal daily range of about $22–$23. Given the current distance from resistance, upside moves are likely capped near $4,590–$4,600 in this session. Here is the 4-hour chart showing the bearish structure:
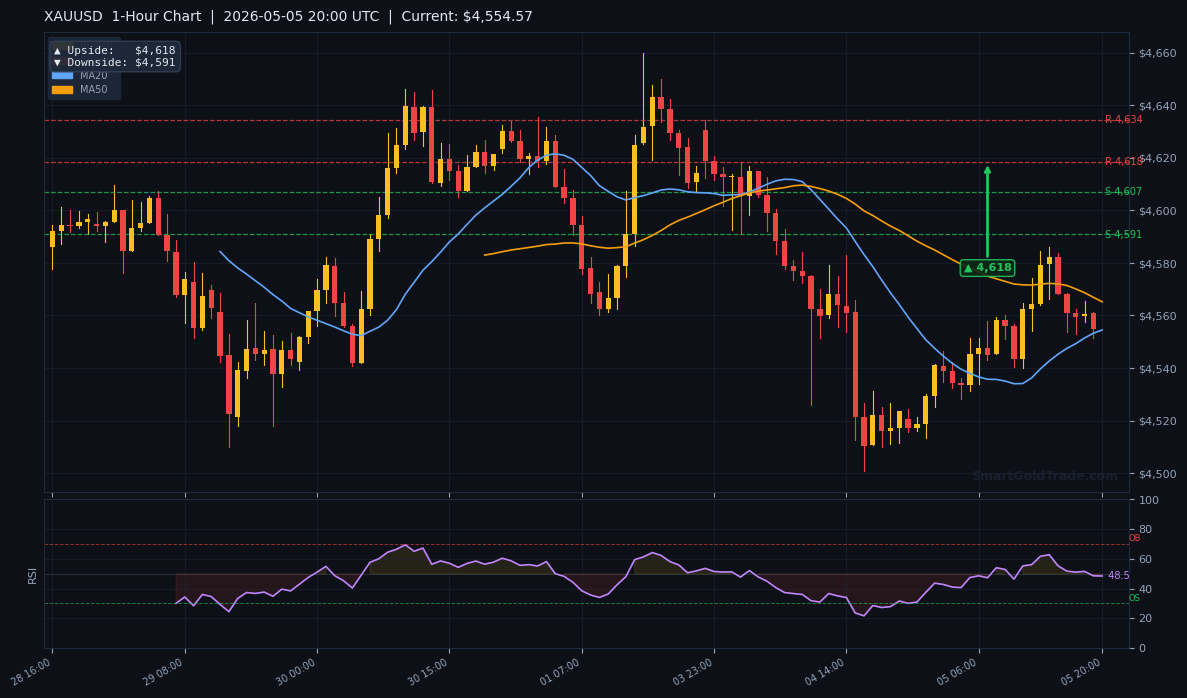
For the intraday view, the 1-hour chart refines the near-term levels:
Fundamental Drivers
Geopolitical Risk Premium
This week’s reports of an alleged Iranian attack on a US Navy vessel—swiftly denied by the Pentagon—kept markets on edge. While unconfirmed, such headlines erode risk appetite and push capital into traditional safe havens like the US Dollar and Treasuries. Gold, which often competes with the dollar for safe-haven flows, initially fell as the dollar strengthened. However, if the situation escalates with confirmed attacks, bullion could reverse higher as a crisis hedge.
Key Event to Watch
The single most important event this week is Thursday’s initial jobless claims report. A significant miss could revive rate-cut expectations and weaken the dollar, providing a tailwind for the gold price. For now, the focus remains on the 12:00 GMT headlines from the Middle East.
Devil's Advocate
A downside break below $4,550 intraday support would invalidate the current choppy consolidation and open the door to the 4-hour downside target at $4,669. The next key level is the daily downside pivot at $4,667. If dollar strength continues—or if geopolitical tensions de-escalate—bears could push the gold price below $4,500. A break back above $4,581.79 would flip the bias neutral.
Trading Strategy for American Session
Entry Zone: Sell on a retest of $4,575–$4,580 (MA20 resistance) with confirmation from a bearish candlestick pattern.
Stop Loss: Above $4,592 (1-hour resistance $4,618 is higher, but a tight stop of $4,585–$4,590 respects the current downtrend).
Take Profit 1: $4,550 (psychological level).
Take Profit 2: $4,525 (extension of recent downside).
Risk-to-reward is approximately 1:2 if using a $5 stop and $10 target. Alternatively, if price breaks below $4,550 with volume, add to short for $4,525 target. The ATR supports a $22 swing, so a wider stop at $4,592 is acceptable for position traders.
For investors looking to hedge, consider purchasing physical gold as a long-term store of value. Active traders can subscribe to professional gold trading signals for real-time entry points.
Key Takeaways
- Gold price trades at $4,567, below all major moving averages – bearish bias.
- DXY at 98.40 driving strength, pressuring gold.
- RSI at 46.4 – neutral, not oversold, room for further decline.
- Immediate resistance at $4,581.79 (MA20); support at $4,550.
- ATR of $22.60 suggests $4,545–$4,590 as the session range.
- 4-hour downside target at $4,669; upside target at $4,725 if structure flips.
Conclusion
The gold price remains under pressure due to a strong dollar and safe-haven flows away from bullion. The bearish moving average structure and neutral RSI argue for selling rallies, not buying dips, in this session. Traders should watch the $4,550 level closely—a break could accelerate losses toward $4,500. Until a catalyst like a weaker dollar or confirmed geopolitical escalation emerges, the path of least resistance is lower.
Frequently Asked Questions
- Is $4,567 a good entry to buy gold?
- Not yet. The trend is bearish and the RSI is neutral. Better to wait for a test of $4,550 or a clear reversal above $4,582.
- Why is gold falling despite Middle East tensions?
- Because investors are buying the US Dollar as a safe haven instead of gold, causing a negative correlation in the short term.
- What is the next major support for gold?
- The daily downside target at $4,667, then $4,500 psychological level. The technical support from the indicator is $4,703, but price is already below it.
- When could gold reverse higher?
- A break above $4,581.79 (MA20) would turn neutral. A rally above $4,618.26 (MA50) would set up a bullish reversal targeting $4,728.
Disclaimer: Trading Gold (XAU/USD) carries significant risk of loss and is not suitable for all investors. This content is for informational purposes only and does not constitute financial advice. Always conduct your own research and trade responsibly.