
The gold price opened the American session at $4,524.35, trading well below all major moving averages and entrenched in a short-term bearish structure. Last week's Middle East headlines and the Fed's divided hold kept the metal under pressure, but the technical setup now suggests a potential bounce toward $4,635 if this week's ISM Services PMI disappoints. This session offers a clear risk‑reward opportunity for nimble traders.
Gold Market Overview
Macro Context
The US Dollar Index (DXY) remains bid above 104.50, pulling from safe‑haven flows amid renewed geopolitical uncertainty in the Middle East. US Treasury yields have steadied near 4.40% after last week's slide, limiting gold's appeal as an interest‑bearing alternative. The Fed's latest decision — a hold with a deeply divided committee — reinforced the message that rates will stay higher for longer, which continues to weigh on the gold price.
Meanwhile, inflated AI stocks are drawing capital away from perceived safe havens. The rotation out of technology into bonds and cash has affected gold indirectly, but the physical market sees steady buying from central banks and retail investors looking to hedge against an uncertain macro backdrop.
Session Outlook
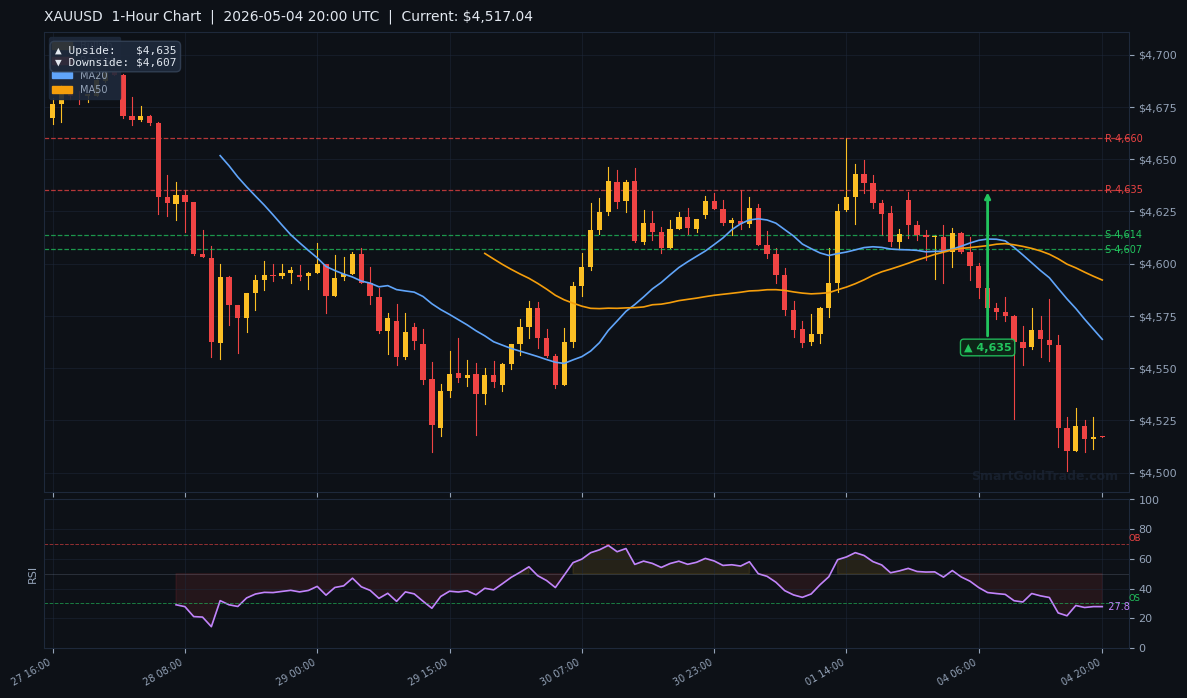
The American session typically brings higher liquidity and sharper moves. With the ISM Services PMI due tomorrow (May 5), traders are positioning cautiously. A reading below 49.0 would likely send the dollar lower and support a gold rally toward the first upside targets. A beat above 50.5 could extend the current bearish momentum. Expect intraday volatility in a $4,607 – $4,635 range based on the 1‑hour technical chart.
Technical Analysis
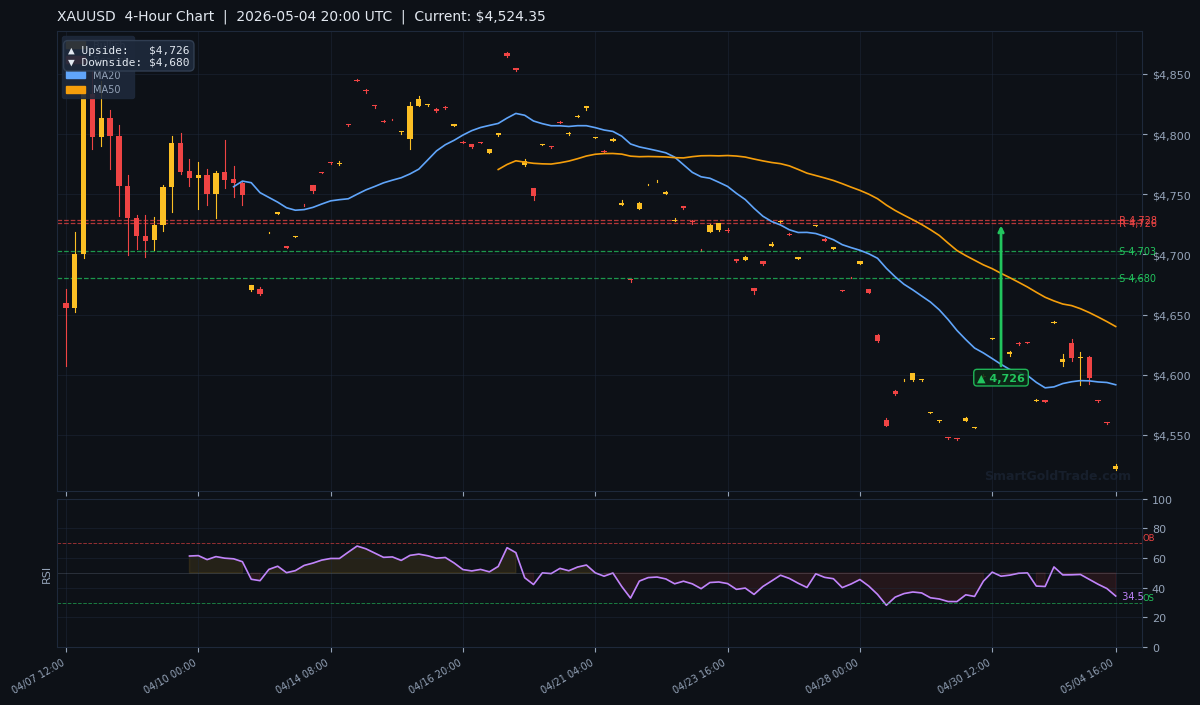
The chart story is clear: the gold price is trading below all three key moving averages, confirming a sustained bearish phase. The MA20 at $4,591.64 is the first line of resistance, followed by the MA50 at $4,640.06 and the MA200 at $4,658.55. Until price reclaims the MA20, any rally should be treated as a counter‑trend bounce.
Moving Average Structure
The EMA structure (MA20 < MA50) confirms short‑term bearish pressure. Price is ~$67 below MA20 and ~$134 below MA200, putting gold deep in bear territory. This does not rule out a corrective snapback, but it means any long position must be actively managed with tight stops.
RSI and Momentum
The RSI(14) sits at 34.5, which is technically neutral but in the lower half of the range. It is not yet oversold (below 30), suggesting there is room for further downside before a relief rally becomes statistically likely. Momentum oscillators remain negative, aligning with the moving average picture.
Key Price Levels
| Level | Price | Note |
|---|---|---|
| Resistance R2 | $4,728.36 | 4H pivot target |
| Resistance R1 | $4,761.77 | Daily resistance |
| Support S1 | $4,703.05 | Now acts as resistance |
| Support S2 | $4,679.99 | Key breakdown level |
The ATR(14) of $23.71 gives an expected daily range of roughly $4,500 – $4,548. This suggests a typical move of less than $25, so the 1‑hour upside target of $4,635 (+$111 from current price) would require a significant catalyst.
Fundamental Drivers
The primary catalyst this week is the US ISM Services PMI for April, due tomorrow. The services sector accounts for the bulk of the US economy, and a weak print would fuel expectations of a Fed pivot later this year. Historically, the gold price has rallied on soft services data because it lowers real yields and weakens the dollar.
Key Event to Watch
The ISM Services PMI is the single most important release this week. A reading below the 50.0 expansion/contraction line would likely push gold above $4,635. Conversely, a strong print could send price below $4,607, the 1‑hour downside target. Stay ahead of the volatility with professional gold trading signals that include real‑time entry and stop‑loss levels.
Devil's Advocate
The main risk to a bullish view is a stronger‑than‑expected ISM print. If services activity surprises to the upside, the dollar could rally sharply, pushing the gold price through the $4,607 support. A break below that level would open the door to a test of the $4,576 area (not shown on charts but a prior swing low). The $4,607 level is the key line in the sand for bulls this session.
Trading Strategy for American Session
Entry zone: Look for a dip toward $4,607 (1‑hour downside target) with a bullish reversal candlestick pattern. This level coincides with the lower range of the ATR expected move. Stop loss: Place at $4,580 (approximately 1.15× ATR below entry). Take profit targets: First target $4,635 (1‑hour upside target), second target $4,680 (4‑hour downside target turned resistance). Use a 1:2 risk‑reward ratio. For traders preferring a more conservative approach, wait for a confirmed close above $4,591.64 (MA20) before going long with a target of $4,635. Those looking for a halal gold trading platform can execute these strategies without leverage or interest, aligning with ethical principles.
Key Takeaways
- Gold price at $4,524.35 is below all major moving averages — bearish bias remains.
- RSI at 34.5 is neutral but leaning toward oversold territory — room for further decline before a bounce.
- Key upside target for this session is $4,635 (1‑hour pivot), with a secondary target at $4,680.
- Downside risk: a break below $4,607 could accelerate losses toward $4,576.
- This week's ISM Services PMI is the critical catalyst — a miss below 50.0 is bullish for gold.
- Expected daily range of $23.71 (ATR) suggests any move beyond $50 requires a strong catalyst.
Conclusion
The gold price remains under pressure but is approaching a technical inflection zone. The $4,607 – $4,635 range will likely define the session, with the ISM Services PMI acting as the trigger for the next directional move. Bulls need to reclaim the MA20 at $4,591.64 to build momentum. Until then, treat any rally as a corrective bounce and manage risk tightly. For those who prefer a hands‑off approach, consider exploring Shariah‑compliant gold investment pools that offer long‑term exposure without short‑term trading stress.
Frequently Asked Questions
- What is the gold price right now?
- The gold price is trading at $4,524.35 as of 20:00 UTC on May 4, 2026, during the American session.
- What is the next key support for gold?
- The immediate support is at $4,607 (1‑hour downside target), followed by $4,576 which is a prior swing low. A break below could open a move to $4,500.
- What level must gold break to turn bullish?
- Bullish momentum would require a close above the MA20 at $4,591.64 and then the MA50 at $4,640.06. The 4‑hour upside target of $4,726 would confirm a trend reversal.
- How does the ISM Services PMI affect gold?
- A weak ISM Services PMI (below 50.0) weakens the dollar and lowers real yields, pushing gold higher. A strong print (above 50.5) does the opposite and puts pressure on the precious metal.
- Is it a good time to buy physical gold?
- For long‑term holders, the current gold price at $4,524 is attractive relative to the recent highs above $5,000. You can purchase physical gold from SmartGoldTrade's store with verified purity and competitive premiums.
Trading Gold (XAU/USD) carries significant risk of loss and is not suitable for all investors. This content is for informational purposes only and does not constitute financial advice. Always conduct your own research and trade responsibly.