
Introduction
The gold price opened the Asian session at $4,643.76, recovering from an early‐week dip near the $4,612.52 baseline. Thin liquidity typical of the Asian window has kept intraday moves measured, but technical structure suggests bulls are positioning for a push toward the key $4,728 resistance level.
Last week's Federal Reserve decision — the most divided hold in recent history — continues to echo through markets, with traders now turning their attention to tomorrow's ISM Services PMI and JOLTS job openings data. Both releases carry high impact for the dollar and, by extension, for gold.
With the RSI(14) sitting at 54.1 and price sandwiched between moving averages, the session ahead offers a well‐defined setup for patient traders. Let's break down the levels that matter.
Gold Market Overview
Macro Context
The DXY held steady near 104.5 during early Asia, reflecting a market in wait‐and‐see mode. US Treasury yields continue to grind lower, with the 2‐year yield slipping 2 basis points overnight — a subtle tailwind for gold. The CME FedWatch Tool now prices a 60% chance of a cut at the June meeting, down from 68% a week ago.
Geopolitical tensions in the Middle East remain elevated, though no fresh catalyst has emerged to drive safe‐haven flows. Markets are instead fixated on the US economic calendar, particularly the ISM Services PMI forecast at 53.8 (slightly below the prior 54.0) and JOLTS job openings at 6.87M (versus 6.88M).
Session Outlook
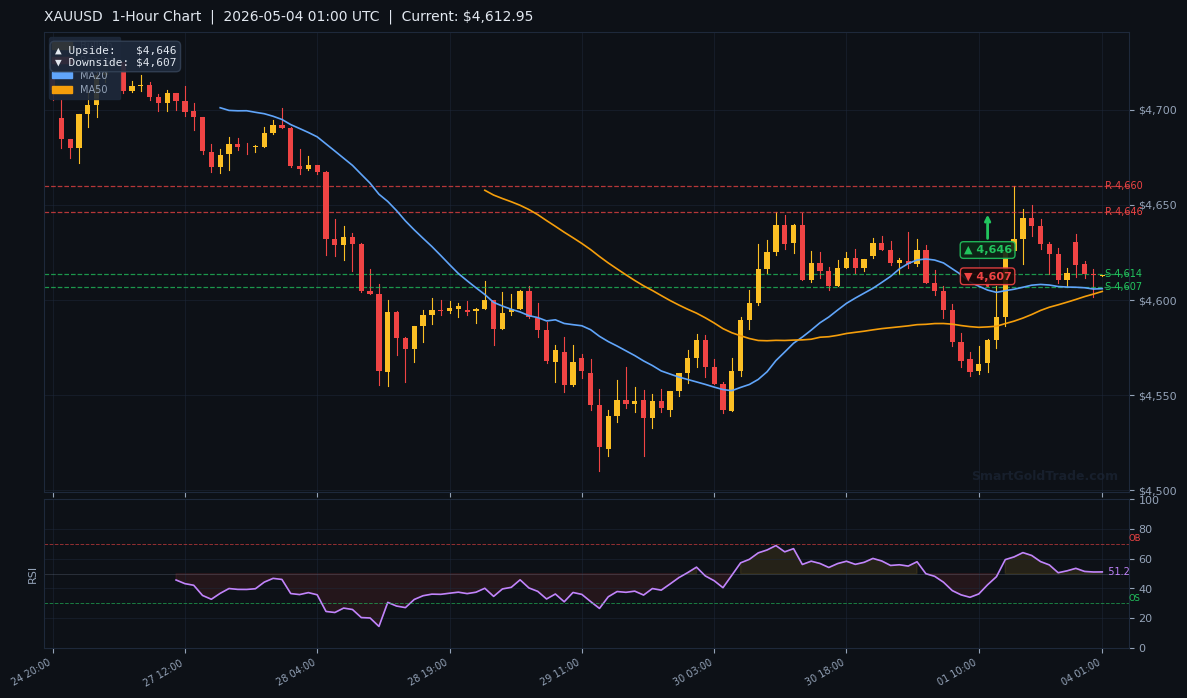
Asian session liquidity is characteristically thin on a Monday after a weekend off. Expect ranges to tighten within the current $4,607–$4,646 1‐hour pivot zone before the New York open. A break above $4,646 opens the path toward $4,728; a failure to hold $4,607 could see a retest of the 4‐hour downside target at $4,680. Chasing moves in low volume is a recipe for whipsaws — patience is key.
Technical Analysis
Moving Average Structure
The MA20 at $4,589.88 sits well below the current price, confirming short‐term bullish momentum. However, the MA50 at $4,661.34 and the MA200 at $4,671.94 are both overhead, forming a resistance zone that has capped rallies since late April. This structure — price above the short‐term but below the medium‐ and long‐term averages — is a classic recovery pattern but not yet a trend reversal.
RSI and Momentum
The RSI(14) reads 54.1, squarely in neutral territory. Neither overbought nor oversold, this leaves room for further upside but also warns against aggressive chasing. Momentum oscillators on the 1‐hour chart show a slight positive divergence, supporting the case for a grind higher.
Key Price Levels
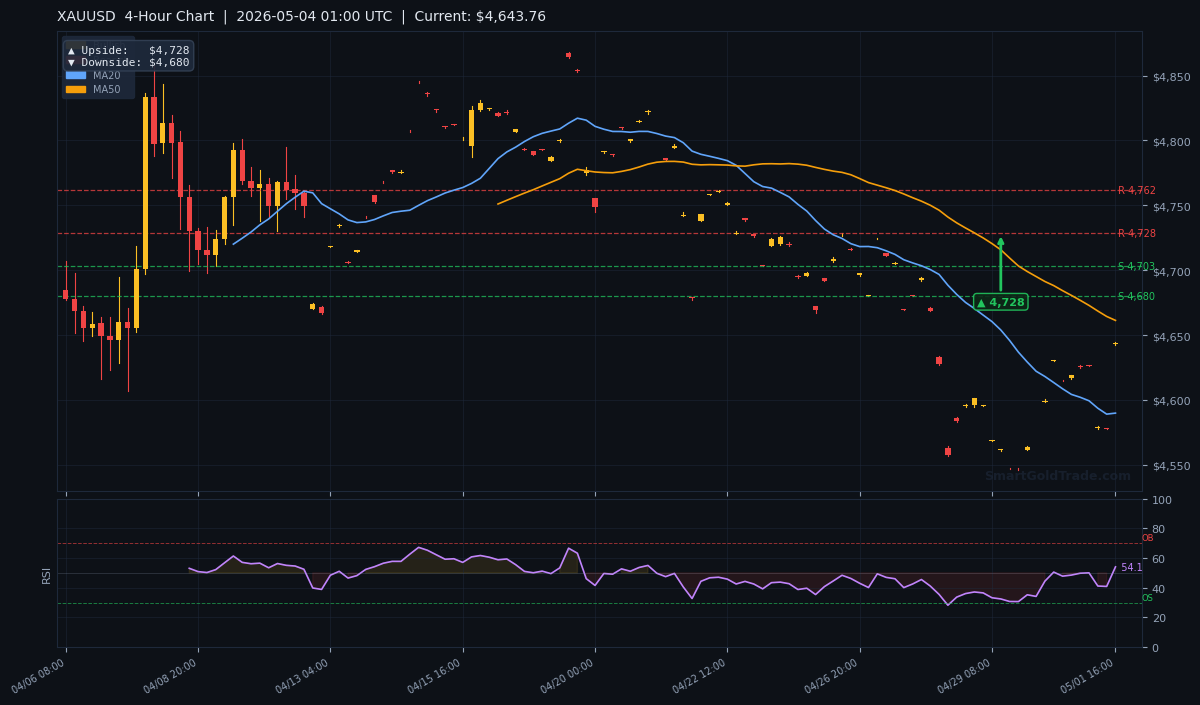
Support levels from the 4‐hour chart stand at S1: $4,703.05 and S2: $4,679.99. On the upside, resistance is R1: $4,823.31 and R2: $4,761.77. The ATR(14) of $19.63 indicates a manageable daily range, keeping the $4,607–$4,646 1‐hour pivot zone in play.
Price Comparison Across Timeframes
| Timeframe | Upside Target | Downside Target |
|---|---|---|
| Daily | $5,045 | $4,967 |
| 4-Hour | $4,728 | $4,680 |
| 1-Hour | $4,646 | $4,607 |
Embedded below are the detailed technical charts for the 4‐hour and 1‐hour timeframes, with pivot arrows marking the exact targets listed above.
Fundamental Drivers
The primary catalyst for this week is the ISM Services PMI and JOLTS job openings, both scheduled for release tomorrow (May 5, 2026, 10:00 ET). A print below the 53.8 forecast would signal contraction in the services sector, likely weakening the dollar and pushing the gold price toward resistance at $4,728. A strong reading, on the other hand, could reinforce hawkish Fed expectations and send gold back toward the $4,607 support.
Key Event to Watch
The single most important event this week is the ISM Services PMI. With the Fed's next decision still weeks away, this data point will shape near‐term rate expectations. Gold has shown a strong inverse correlation with the US Dollar Index in recent weeks — any miss on the data could fuel a swift rally. Conversely, a beat would test the current support structure.
Devil's Advocate
The primary bullish bias hinges on a break above $4,646. What could invalidate it? A failure to hold the $4,607 1‐hour support would expose the 4‐hour downside target of $4,680. If the ISM data comes in above 54.5, the dollar could surge, and gold could break below the MA20 ($4,589.88), flipping the short‐term trend bearish. Traders should watch for a daily close below $4,607 to shift bias.
Trading Strategy for Asian Session
Given thin liquidity and the quiet start, the most reliable approach is to wait for a confirmed break of the 1‐hour pivot levels. Entry zone: Buy on a breakout above $4,646 with a stop loss at $4,620 (approximately 1 ATR below). Take profit targets: $4,680 (first), $4,728 (second). Alternatively, sell on a breakdown below $4,607 with a stop at $4,633, targeting $4,580 and $4,560. For larger timeframes, traders can use the 4‐hour resistance at $4,728 as a sell zone if price reaches there during low volume, with a tight stop above $4,740.
For those who prefer a hands‐off approach, consider following professional strategies through copy trading to mirror expert execution in real time.
Key Takeaways
- The gold price is trading at $4,643.76, above the MA20 but below the MA50 and MA200.
- Immediate resistance is $4,646 (1‐hour pivot), followed by $4,728 (4‐hour target).
- Support lies at $4,607 and $4,680 (4‐hour downside target).
- The RSI(14) at 54.1 leaves room for either direction; momentum is neutral.
- Key catalysts: ISM Services PMI and JOLTS on May 5 — a miss below 53.8 is bullish gold.
- The $4,728 level is the next major hurdle; a close above it opens the path to $4,761.
Conclusion
The gold price enters a critical week with a defined technical setup and a high‐impact economic calendar ahead. Bulls need to clear the $4,646–$4,661 zone to gain momentum, while a failure below $4,607 would weaken the short‐term structure. Tomorrow's ISM Services PMI will likely determine the next directional move. For now, the bias remains cautiously bullish above $4,607, with $4,728 as the near‐term target. Trade the levels, not the noise.
Frequently Asked Questions
- What is today's gold price?
- The gold price (XAUUSD) is currently trading at $4,643.76 as of the early Asian session on May 4, 2026.
- What is the next resistance level for gold?
- The immediate resistance is $4,646 on the 1‐hour chart, with a stronger barrier at $4,728 on the 4‐hour timeframe.
- What is the key support for gold in this session?
- Key support lies at $4,607 (1‐hour pivot) and $4,680 (4‐hour target). A break below $4,607 could trigger a move toward $4,580.
- How does the ISM Services PMI affect gold?
- A weaker‐than‐expected reading (below 53.8) typically weakens the US dollar and supports gold. A strong reading above 54.5 could pressure gold lower.
Risk Disclaimer: Trading Gold (XAU/USD) carries significant risk of loss and is not suitable for all investors. This content is for informational purposes only and does not constitute financial advice. Always conduct your own research and trade responsibly.