
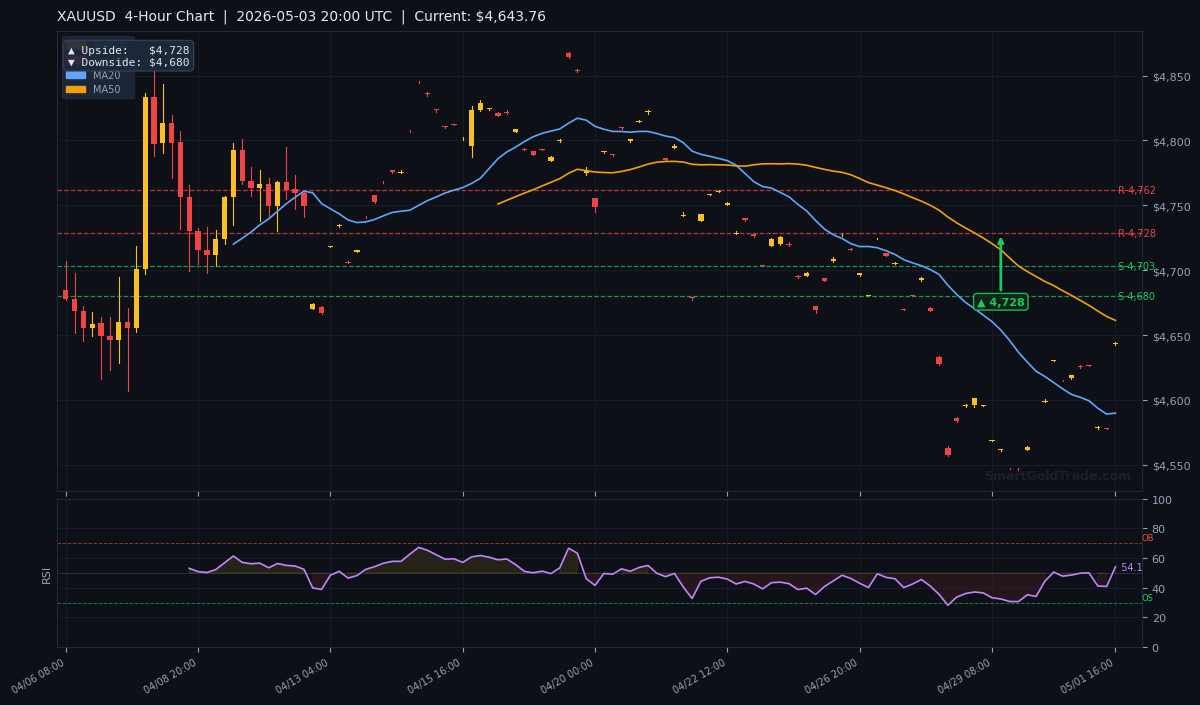
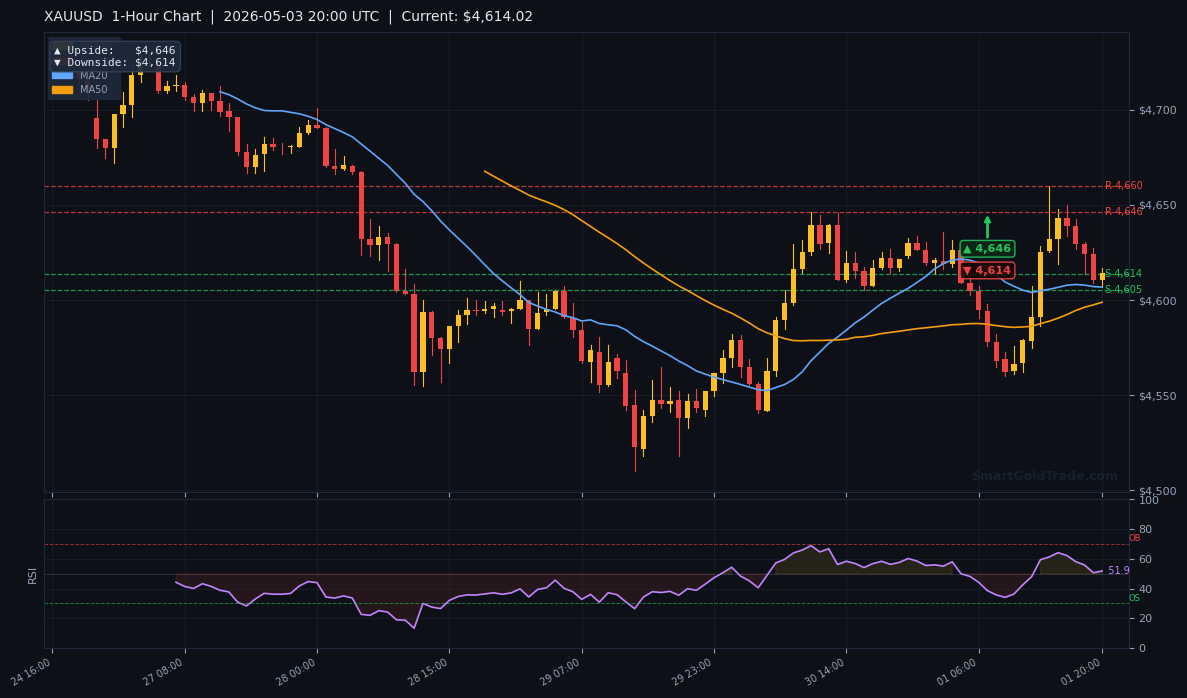
The gold price opened the week with a bright start, building on last week's post-Fed rally. As the American session gets underway on May 3, XAU/USD trades at $4,643.76, sitting just below the critical 50-period moving average. The Fed's most divided hold on rates still reverberates, but the immediate technical picture suggests a short-term pullback may be the higher-probability trade. This session, expect a test of the MA50 resistance zone at $4,661, with a potential reversal toward the 1-hour downside target of $4,614.
Gold Market Overview
Macro Context
The US Dollar Index (DXY) has stabilised near 104.50 after sliding last week on the dovish Fed outcome. Treasury yields remain subdued, with the 10-year yield holding at 4.28% as markets price in a higher probability of a rate cut in September. The gold price has benefited from the weaker dollar and lower real yields, but the rally has stalled ahead of the MA50 resistance. Geopolitical risks in the Middle East provide a background bid, though no fresh escalation has occurred.
Session Outlook
Liquidity is thinner on Sunday openings, but the American session often sees larger institutional flows. The likely range for this session is $4,614 to $4,672, bracketed by the 1-hour downside pivot and the 200-period moving average. A break above $4,661 (MA50) could open a path toward $4,680 (4-hour support turned resistance) and then $4,728. However, the bearish MA20/MA50 crossover favours sellers near resistance.
Technical Analysis
Moving Average Structure
The 20-period MA sits at $4,589.88, well below the current price — a short-term bullish sign. However, the 50-period MA at $4,661.34 acts as a ceiling, while the 200-period MA at $4,671.94 reinforces the overhead supply. Critically, the MA20 is below the MA50, creating a short-term bearish crossover that suggests any bounce toward resistance will be sold.
RSI and Momentum
The 14-period RSI reads 54.1 — neutral territory, providing no extreme overbought or oversold signal. This allows for either a push higher towards resistance or a reversal without immediate divergence. Momentum oscillators are flat, indicating the market is waiting for a catalyst.
Key Price Levels
Support levels: S1: $4,703.05 (unlikely to be tested today), S2: $4,679.99. Resistance: R1: $4,823.31, R2: $4,761.77. More actionable are the chart pivot targets: 4-hour upside $4,728, 4-hour downside $4,680, 1-hour upside $4,646, 1-hour downside $4,614. The ATR of $19.63 implies an expected intraday range of about $39.
| Timeframe | Upside Target | Downside Target |
|---|---|---|
| Daily | $5,045 | $4,967 |
| 4-Hour | $4,728 | $4,680 |
| 1-Hour | $4,646 | $4,614 |
Fundamental Drivers
The main catalyst for the recent gold price surge was last week's Federal Reserve decision, where the committee delivered its most divided hold on interest rates in years. Two dissents favoured a cut, boosting expectations for easier policy by Q3. This dovish tilt pressured the dollar and lifted gold from $4,576 support to above $4,600. Additionally, China's PMI data showed expansion in manufacturing, supporting global demand optimism.
Key Event to Watch
This week, the market will closely watch the US ISM Services PMI due on Wednesday (May 5). A reading below 50 would reinforce recession fears, likely pushing gold price higher. Conversely, a strong number could trigger a dollar rally and weigh on gold. Also on the calendar: weekly jobless claims on Thursday.
Devil's Advocate
The bearish bias could be invalidated if gold price breaks and closes above $4,661 (MA50). A confirmed break would flip the structure to bullish, targeting first $4,680 (4-hour downside pivot turned support) and then $4,728. Additionally, if geopolitical tensions escalate suddenly, safe-haven buying could overwhelm technical resistance. The key level to watch for a reversal of the bearish view is a daily close above $4,672 (MA200).
Trading Strategy for American Session
Given the overhead resistance and bearish MA crossover, a short trade from $4,661 (MA50) is favoured. Use a stop loss at $4,672 (just above MA200) to protect against a break higher. The take-profit target is $4,614 (1-hour downside pivot). This offers a risk of $11 per ounce and a reward of $47 per ounce — a risk-reward ratio of approximately 1:4.3. If price fails to reach the entry, a break below $4,614 could accelerate selling toward $4,589 (MA20). For those preferring a reactive approach, wait for a bearish candlestick rejection at $4,661 before entering. This setup aligns with the halal gold trading principles of spot trading without leverage.
Key Takeaways
- Gold price currently at $4,643.76, facing resistance at MA50 ($4,661).
- Short-term bias is bearish due to MA20/MA50 crossover and price below MA200.
- Key support at $4,614 (1-hour downside target); a break below opens $4,589.
- Upside break above $4,672 invalidates the bearish view, targets $4,728.
- RSI at 54.1 neutral — no overbought/oversold extremes.
- ATR of $19.63 suggests volatile session possible; position sizing is critical.
Conclusion
The gold price is at a inflection point this American session. While the post-Fed rally has stalled, the technical structure favours a short-term pullback before any continuation higher. Traders should watch the $4,661 resistance closely for a selling opportunity with a tight stop. If the bears fail to hold that line, a move toward $4,680 becomes likely. The next few hours will determine whether the week's bright start fades or strengthens. As always, use proper risk management and consider professional gold trading signals for real-time alerts.
Frequently Asked Questions
- What is the current gold price on May 3, 2026?
- The gold price is trading at $4,643.76 per troy ounce during the American session.
- What are the key support levels for gold today?
- The first support is at $4,614 (1-hour downside pivot), followed by $4,589.88 (MA20). A deeper support lies at $4,576.
- Should I buy or sell gold based on this analysis?
- The short-term bias is bearish. A short entry near $4,461 (MA50) with a stop at $4,672 and target $4,614 aligns with the current structure. Only consider buying if price breaks and holds above $4,672.
- What technical indicator is most important right now?
- The MA50 at $4,661.34 is the most critical level. The price below MA200 and the bearish MA20/MA50 crossover reinforce the resistance zone.
Trading Gold (XAU/USD) carries significant risk of loss and is not suitable for all investors. This content is for informational purposes only and does not constitute financial advice. Always conduct your own research and trade responsibly.