
Our gold price forecast next week looks at XAU/USD opening at $4,643.76, up from Friday's close of $4,613.82, as a softer US dollar and renewed tariff jitters drive safe-haven flows. Last week, the yellow metal surged 19% from recent lows but stalled at major resistance, leaving the near-term structure bearish on the 4‑hour timeframe. This forecast covers May 03–May 09, 2026, and provides actionable levels for the week ahead.
Last Week in Review
Price Action Recap
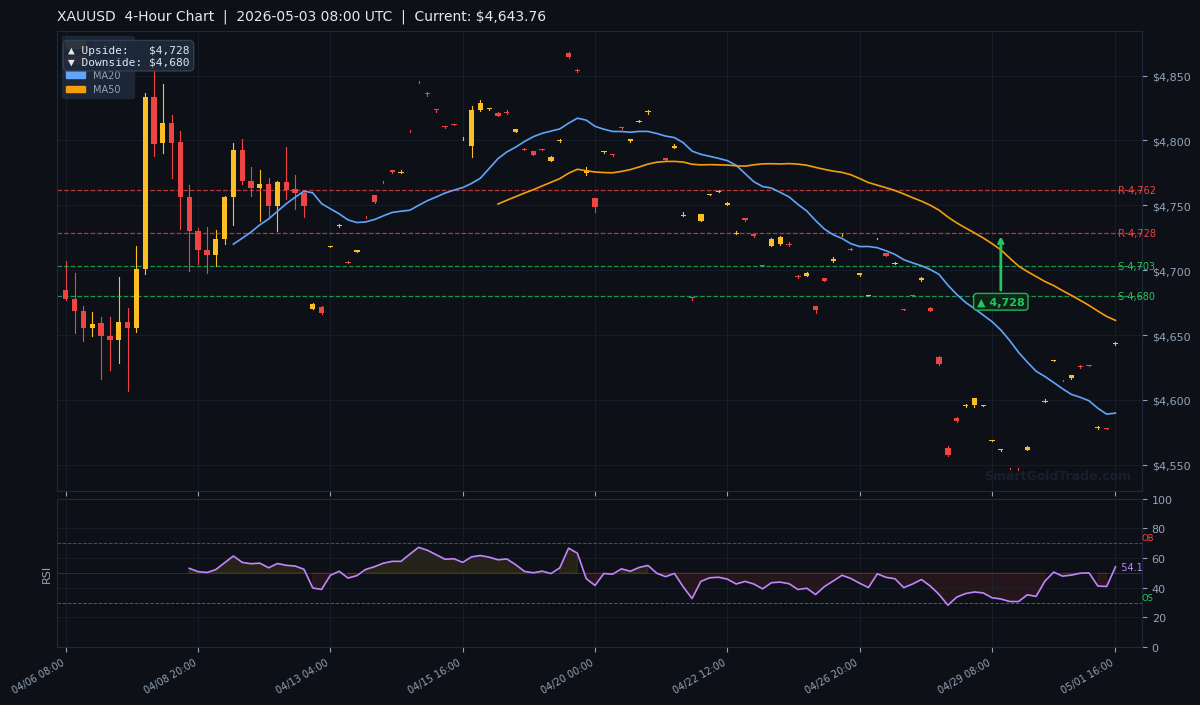
Gold made a bright start to the week, climbing from $4,570 to a weekly high of $4,670 before reversing. The move was fueled by a weakening US Dollar Index, which sank to two‑week lows as tariff tensions resurfaced. However, the rally stalled at the $4,670 resistance zone and the metal retreated to close at $4,614, leaving a long upper wick on the weekly candlestick that signals persistent selling pressure near that level.
Key Events That Moved Gold
Last week's CFTC report showed speculative net longs dipping to $159.6K from $164K, reflecting cautious positioning. Meanwhile, the US Dollar Index rebounded from its lows after fresh Trump tariff threats against European Union goods unsettled markets. Geopolitical uncertainty from Iran tensions also kept safe‑haven bids intact, while Eurozone CFTC data revealed a decline in net euro longs, indicating broader USD strength expectations that capped gold's upside.
Weekly Close Analysis
Gold closed above the psychological $4,600 mark but below both the 50‑period ($4,661.34) and 200‑period ($4,671.94) moving averages on the 4‑hour chart. This close reinforces the bearish mid‑ and long‑term bias, despite the short‑term bounce above the MA20 ($4,589.88). The weekly candle's wick above $4,650 signals that sellers are active at higher levels, making a sustained break above $4,670 critical for bulls.
Gold Price Forecast Next Week: Economic Calendar and Impact
The coming week's economic calendar, central to any gold price forecast next week, features multiple high‑impact releases that could determine gold's direction. Below is the day‑by‑day breakdown with likely gold reactions.
| Day | Event | Forecast | Previous | Gold Impact |
|---|---|---|---|---|
| Mon May 04 | US Factory Orders (Mar) | +0.2% | +0.5% | Weaker data → dovish → bullish gold |
| Tue May 05 | RBA Rate Decision | 4.10% (hold) | 4.10% | Hawkish hold → AUD up, USD down → bullish gold |
| Tue May 05 | US ISM Services PMI (Apr) | 52.0 | 51.4 | Beat → USD up → bearish gold; Miss → bullish |
| Wed May 06 | US ADP Employment (Apr) | 150K | 184K | Miss → dovish → bullish gold |
| Thu May 07 | US Initial Jobless Claims | 220K | 215K | Rise → safe‑haven → bullish gold |
| Fri May 08 | US Michigan Consumer Sentiment (May prelim) | 78.5 | 79.0 | Weaker sentiment → risk‑off → bullish gold |
Additionally, the RBA decision on Tuesday will be closely watched. A surprise cut would boost gold, while a hawkish hold may strengthen the AUD and weigh on the USD, indirectly supporting XAU/USD. The ISM Services PMI is the week's biggest risk event: a strong print above 52.5 could trigger a USD rally and push gold below $4,600.
Technical Analysis
Moving Average Structure
The 4‑hour chart shows price trading above the MA20 ($4,589.88) but below the MA50 ($4,661.34) and MA200 ($4,671.94). The EMA structure remains bearish as MA20 < MA50, confirming short‑term downward pressure. Until gold reclaims the MA50, any rally is considered a correction within a larger downtrend.
RSI and Momentum
RSI(14) stands at 54.1, squarely in neutral territory. This leaves room for both bullish and bearish moves without being overbought or oversold. A move above 60 would confirm bullish momentum, while a dip below 40 would signal accelerating selling.
Bollinger Bands and MACD
On the 4H chart, Bollinger Bands (20,2) have started to contract, with price hovering near the middle band at $4,590. This squeeze typically precedes a volatility expansion, aligning with the ISM Services release mid‑week. A break above the upper band near $4,700 would confirm bullish momentum, while a dip below $4,580 would open the lower band around $4,520. The MACD histogram is printing higher lows, hinting at a potential bullish divergence, though the signal line remains in negative territory. A bullish crossover above the zero line would add conviction to the upside scenario.
Key Support and Resistance Levels
Immediate support sits at S2 ($4,679.99) and S1 ($4,703.05). On the upside, resistance is at R2 ($4,761.77) and R1 ($4,823.31).
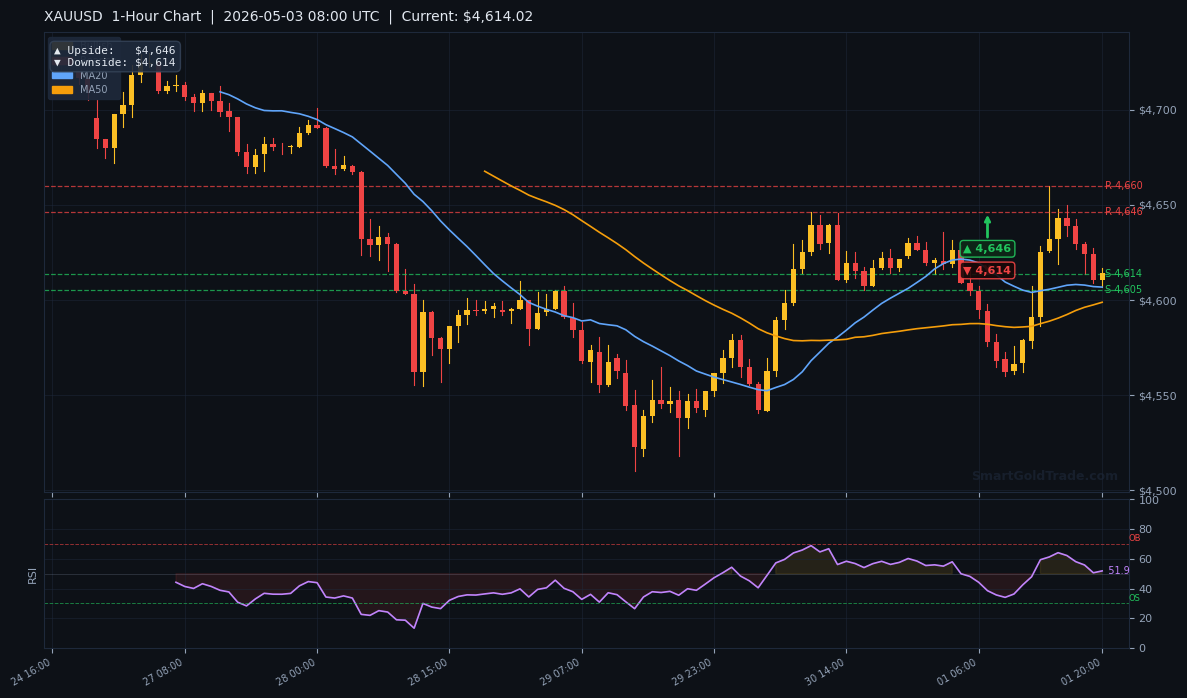
The daily pivot targets point to an upside target of $5,045 and a downside target of $4,967, though these are longer‑term projections. For the coming week, the H4 chart shows an upside target at $4,728 and a downside target at $4,680, while the H1 chart pins immediate moves at $4,646 and $4,614. ATR(14) of $19.63 implies an average daily range of about $20, so a weekly range of $4,600–$4,660 is plausible if no catalyst emerges.
Trading Scenarios This Week
Bullish Scenario (probability 45%)
- Trigger: A daily close above $4,661 (MA50) on strong volume, confirmed by RSI crossing 60.
- Entry zone: $4,645–$4,660
- Target: $4,728 (H4 upside pivot), then $4,762 (R2)
- Stop loss: Below $4,613 (H1 downside pivot)
Bearish Scenario (probability 40%)
- Trigger: Rejection at $4,650–$4,661 followed by a break below $4,614 (H1 downside).
- Entry zone: $4,620–$4,610
- Target: $4,580 (MA20), then $4,520
- Stop loss: Above $4,670
Neutral / Range-Bound Scenario (probability 15%)
- If the ISM Services PMI prints in line with forecasts and no major surprises emerge, gold may oscillate between $4,614 and $4,661.
- Mean reversion trades from the range extremes with tight stops offer low‑risk opportunities.
- Look for rejection wicks at $4,660 to sell and support bounces at $4,615 to buy.
Risk Factors to Watch
A surprise escalation in US‑EU trade talks could crush the dollar and send gold above $4,700. Conversely, a stronger‑than‑expected ISM Services reading combined with hawkish Fed commentary would likely break the $4,600 support. Keep an eye on geopolitical headlines from the Middle East — any sudden escalation could invalidate all technical levels and trigger a violent spike in gold, while a close below $4,580 would flip the bias firmly bearish.
Key Takeaways
- Gold opens the week at $4,643.76, above the MA20 but below MA50 and MA200.
- The RSI at 54.1 leaves room for a move in either direction before exhaustion.
- Bullish trigger: a close above $4,661 targets $4,728 and $4,762.
- Bearish trigger: a break below $4,614 opens the path to $4,580 and $4,520.
- A neutral range between $4,614 and $4,661 is likely if economic data prints in line.
- Key event risk: US ISM Services PMI on Tuesday — a miss above 52.5 could cap gold.
Conclusion
Overall, this gold price forecast next week suggests a cautiously bullish short‑term bias, but the larger technical picture remains bearish until the MA50 is reclaimed. The $4,661 level is the line in the sand: a daily close above it would signal a shift in momentum and open a run toward $4,728. Conversely, failure to hold $4,614 in the face of strong US data would reaffirm the downtrend.
Traders should adjust position sizing ahead of the ISM Services release and consider using halal gold trading platforms for interest‑free exposure. For those seeking real‑time trade ideas, professional gold trading signals provide entry and stop levels.
FAQ
- What is the gold price forecast next week?
- Gold is expected to trade between $4,614 and $4,728, with a neutral to bullish bias. A clear break above $4,661 targets $4,728, while a drop below $4,614 could lead to $4,580.
- Will gold go up or down this week?
- Direction depends on the US ISM Services PMI and RBA decision. If data disappoints, gold could rally toward $4,728. Strong data may push it back to $4,600.
- What is the support level for gold this week?
- Immediate support is at $4,679.99 (S2) and $4,613.82 (Friday close). A break below $4,614 exposes $4,580.
- What is the resistance level for gold this week?
- Key resistance is at $4,661 (MA50), followed by $4,728 (H4 upside target) and $4,762 (R2).
- How does the US dollar affect gold this week?
- A weaker USD, driven by disappointing ISM Services or a dovish RBA, supports gold. A stronger USD would cap gains below $4,661.
- Is gold a safe investment this week?
- Gold remains a safe‑haven asset, but the technical structure suggests caution. Use tight stops and consider physical gold for long‑term hedging.
Trading Gold (XAU/USD) carries significant risk of loss and is not suitable for all investors. This content is for informational purposes only and does not constitute financial advice. Always conduct your own research and trade responsibly.