
The gold price is trading at $4,615.40 as the American session gets underway, recovering sharply from the $4,550 zone hit after the Federal Reserve's most divided hold decision since 1992. The market is now pricing in a more cautious Fed, which has reignited bullish momentum for XAU/USD. Traders are watching whether this bounce can extend toward the $5,045 daily target.
Gold Market Overview
Macro Context
The U.S. Dollar Index (DXY) softened overnight, falling 0.3% as Treasury yields retreated from session highs. The 10-year yield dipped to 4.22%, reducing the opportunity cost of holding non-yielding bullion. The Fed's 7-5 vote to hold rates — the most divided since 1992 — signals deep internal disagreement over the inflation trajectory. This uncertainty is a tailwind for gold as a safe-haven asset.
Geopolitical risks remain elevated, with ongoing trade tensions and Middle East instability adding to the demand for physical gold. The macro backdrop supports a bullish bias for the yellow metal in the medium term.
Session Outlook
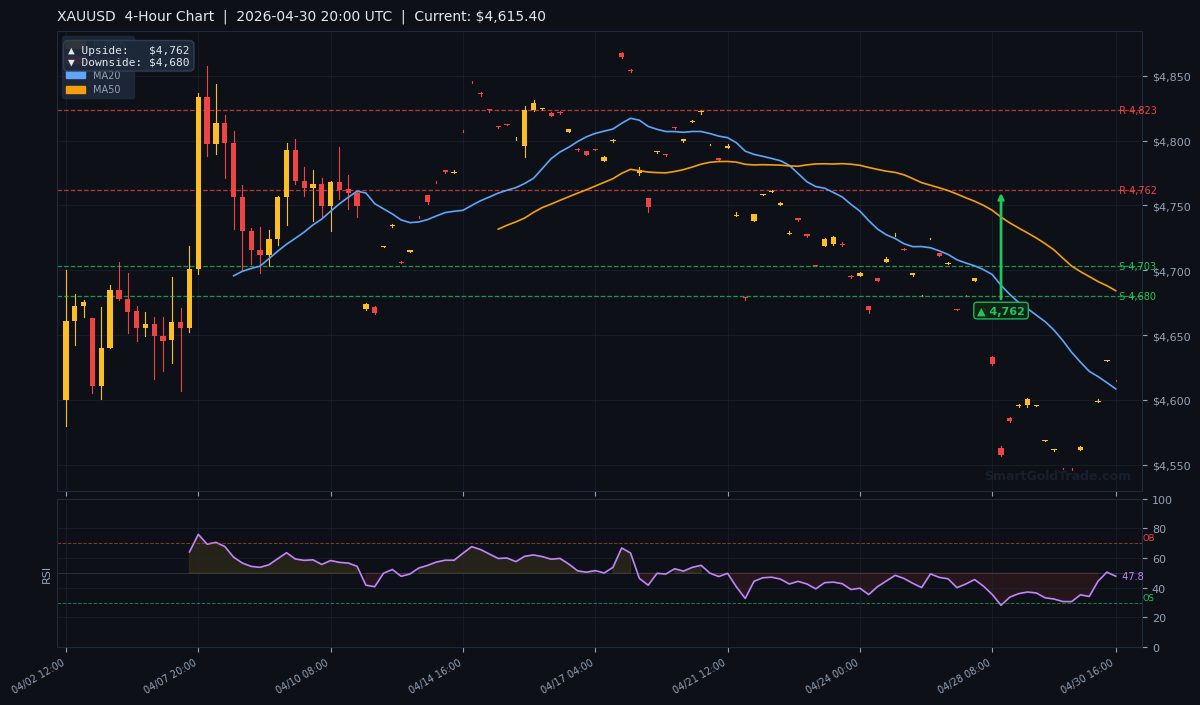
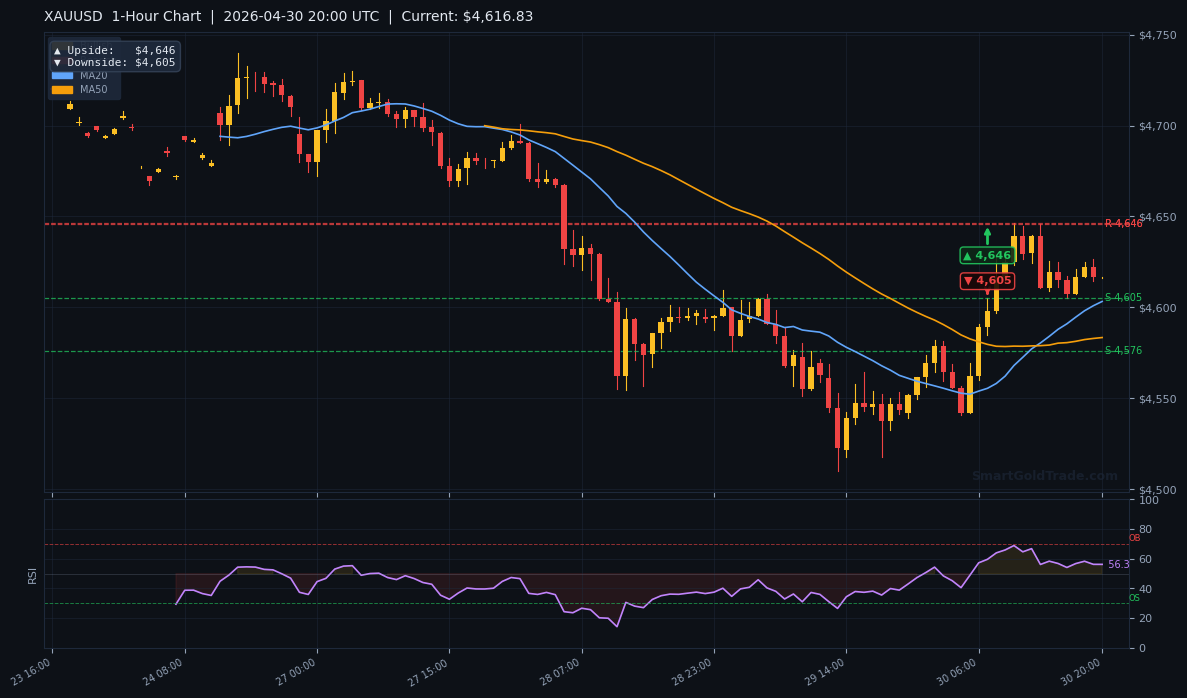
During the American session, liquidity is expected to pick up after the European lull. Key levels to watch are the $4,605 short-term support and the $4,646 resistance. A close above the 1-hour pivot could trigger a run toward the 4-hour upside target of $4,762. The Fed minutes from last week's meeting will be released on Wednesday, so traders are positioning cautiously ahead of that event.
Technical Analysis
The technical picture shows a market trying to find its footing after the initial shock of the Fed decision. Let's break down the key indicators.
Moving Average Structure
The MA20 sits at $4,608.64, and the current price of $4,615.40 is above this short-term average, suggesting intraday bullish momentum. However, the MA50 at $4,684.26 and the MA200 at $4,683.90 are both well above price, confirming a bearish medium-term trend. The EMA structure (MA20 < MA50) reinforces that the recent recovery is a counter-trend bounce within a larger downtrend.
RSI and Momentum
The RSI(14) reads 47.8, which is neutral territory. This indicates that the recent surge has not yet reached overbought levels, leaving room for further upside before exhaustion sets in. Traders should watch for a break above 50 to confirm bullish momentum acceleration.
Key Price Levels
Support levels from the indicator data: S1 at $4,745.01 and S2 at $4,703.05. These are notably above the current price, meaning they could act as resistance if price rallies that far. Resistance levels: R1 at $4,868.16 and R2 at $4,823.31. The ATR(14) of $21.22 suggests a daily range of roughly $42, so moves within $4,594–$4,636 are normal.
| Timeframe | Upside Target | Downside Target |
|---|---|---|
| Daily | $5,045 | $4,967 |
| 4-Hour | $4,762 | $4,680 |
| 1-Hour | $4,646 | $4,605 |
Fundamental Drivers
The main catalyst was the Fed's decision last week, where the FOMC voted 7-5 to hold rates steady — the most divided outcome since 1992. This deep split suggests that the next move could be a cut if economic data weakens further, which is bullish for gold. The market is now pricing in a 60% chance of a cut in June.
The U.S. dollar has weakened 0.5% since the decision, and gold has reclaimed the $4,600 handle. Geopolitical risks continue to support safe-haven inflows, particularly from central banks buying physical gold.
Key Event to Watch
This week's most important event is the FOMC minutes release on Wednesday, May 1. Traders will parse the tone for clues on the next rate decision. Any dovish language could propel gold above $4,700, while hawkish surprises may trigger a retest of $4,550.
Devil's Advocate
The bullish case rests on the Fed turning dovish and the dollar weakening. However, if the FOMC minutes reveal a majority still hawkish and the economy stays resilient, gold could reverse sharply. The key level to watch is $4,605 on the 1-hour chart. A break below that support would invalidate the short-term bounce and open the door to $4,575. If price loses $4,605, traders should exit long positions and consider short entries targeting $4,550.
Trading Strategy for American Session
Entry Zone: Look to buy on a pullback to $4,610–$4,615, which coincides with the 1-hour support area and the MA20. Stop Loss: Place at $4,590 — 1 ATR below entry to account for volatility. Take Profit Targets: First target $4,646 (1-hour upside pivot), second target $4,680 (4-hour downside pivot, now acting as resistance turned support). If momentum is strong, hold for $4,762 (4-hour upside target). For aggressive traders, a break above $4,646 with volume can be chased with a stop at $4,625 and target $4,680. Remember that gold price is still below key moving averages, so any trade should be managed with tight stops. For those preferring a passive approach, halal gold trading on SmartGoldTrade offers a Shariah-compliant way to participate without leverage or interest.
Key Takeaways
- Gold price at $4,615.40 — up from $4,550 post-Fed dip.
- MA20 at $4,608.64 is breached; next resistance is MA50 at $4,684.26.
- RSI at 47.8 — neutral, with room for further upside.
- Short-term 1-hour targets: upside $4,646, downside $4,605.
- Daily upside target: $5,045; downside target: $4,967.
- Fed minutes on Wednesday are the key risk event this week.
Conclusion
The gold price has staged a convincing recovery from last week's Fed shock, but the medium-term trend remains bearish. For today, the bias is bullish as long as price holds above $4,605. A push through $4,646 will confirm the next leg higher toward $4,762. Trade with discipline, respect the ATR, and watch the dollar closely. The Fed minutes will set the tone for the rest of the week. For real-time entry alerts, consider professional gold trading signals that track institutional moves.
Frequently Asked Questions
- What is the gold price today?
- The gold price (XAU/USD) is trading at $4,615.40 as of April 30, 2026 American session.
- Why did gold drop below $4,550 after the Fed meeting?
- The Fed's rate hold was expected, but the deeply split vote (7-5) created uncertainty about future policy. Initially, the dollar strengthened, pushing gold lower. However, the market quickly reassessed, and gold recovered as expectations for a rate cut increased.
- What is the key support and resistance for gold now?
- Key support on the 1-hour chart is $4,605; below that, $4,575. Resistance is at $4,646 (1-hour), then $4,680 (4-hour), and the daily target of $5,045.
- Is it a good time to buy gold?
- For short-term traders, a buy on pullback to $4,610–$4,615 with a stop at $4,590 offers a favorable risk-reward toward $4,646 and $4,680. Long-term investors may wait for a clear break above MA50 at $4,684 to confirm trend reversal.
Trading Gold (XAU/USD) carries significant risk of loss and is not suitable for all investors. This content is for informational purposes only and does not constitute financial advice. Always conduct your own research and trade responsibly.