
The gold price opened the American session at $4,547.37, extending its bearish slide after a quiet Asian session. Bulls stepped aside as markets priced in a delayed US Non-Farm Payrolls report, leaving the short-term trend firmly in bear territory. With price now below all major moving averages, the immediate focus shifts to the 1-hour downside pivot at $4,576 — a break below could accelerate selling toward $4,703.
Traders should brace for increased volatility as the NY session unfolds. Key economic data remains absent, but technical pressure is building.
Gold Market Overview
Macro Context
The US Dollar Index (DXY) edged higher during early NY trading, adding headwinds to the gold price. Treasury yields remained elevated after hawkish comments from Fed governor Waller late yesterday. Geopolitical risks simmer in the background, but the market's focus is squarely on Friday's delayed NFP report. Until then, gold lacks a strong catalyst for a bullish reversal.
Session Outlook
The American session typically brings higher liquidity and sharper moves. With the gold price already below key moving averages, any further deterioration in risk sentiment could trigger stop-loss runs. The ATR(14) of $22.36 suggests a normal daily range, but a break below $4,576 could easily expand that to $30+ in a single candle. Watch for a re-test of $4,576 and a potential bounce or breakdown.
Technical Analysis
Moving Average Structure
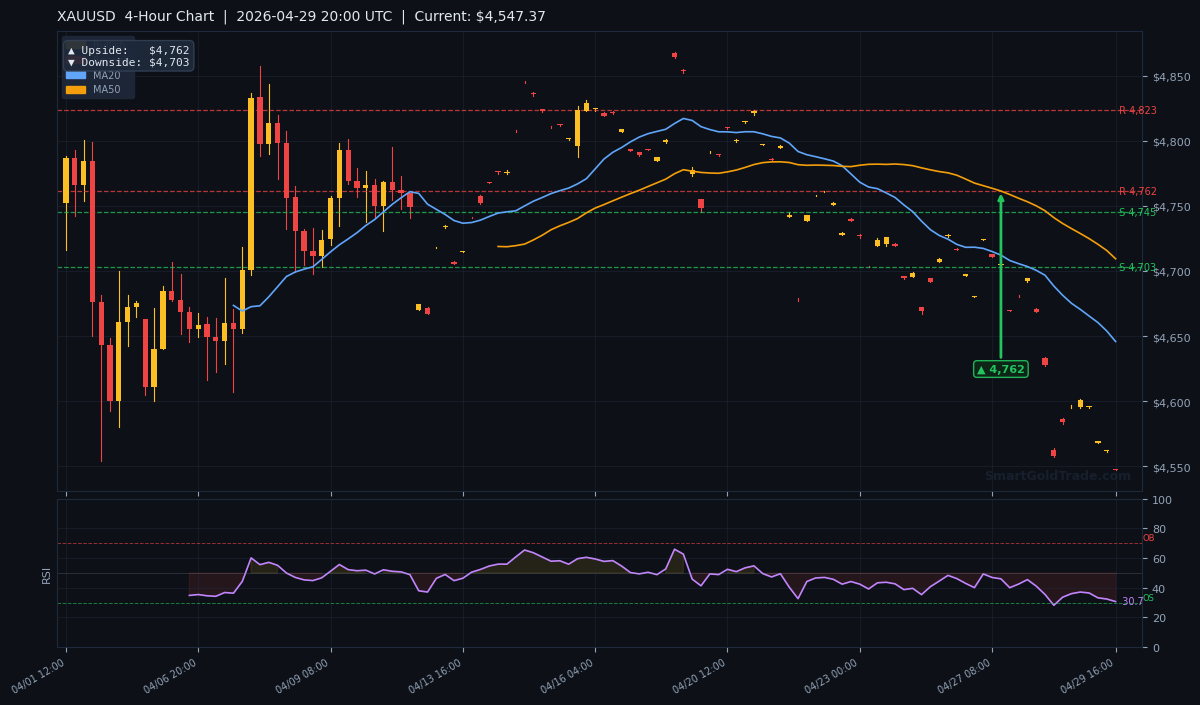
The MA20 sits at $4,645.85, the MA50 at $4,709.41, and the MA200 at $4,696.57. All three are above the current gold price, confirming a bearish trend across short, medium, and long timeframes. The short-term EMA structure — MA20 below MA50 — reinforces the selling pressure. Until price reclaims at least the MA20, any rally is likely to be sold into.
RSI and Momentum
The RSI(14) stands at 30.7, right at the edge of oversold territory. While not yet oversold (below 30), a further drop would push it into deep bearish territory. In neutral range, there is room for a dead-cat bounce, but momentum remains firmly negative. Divergence is not present yet — bears are in full control.
Key Price Levels
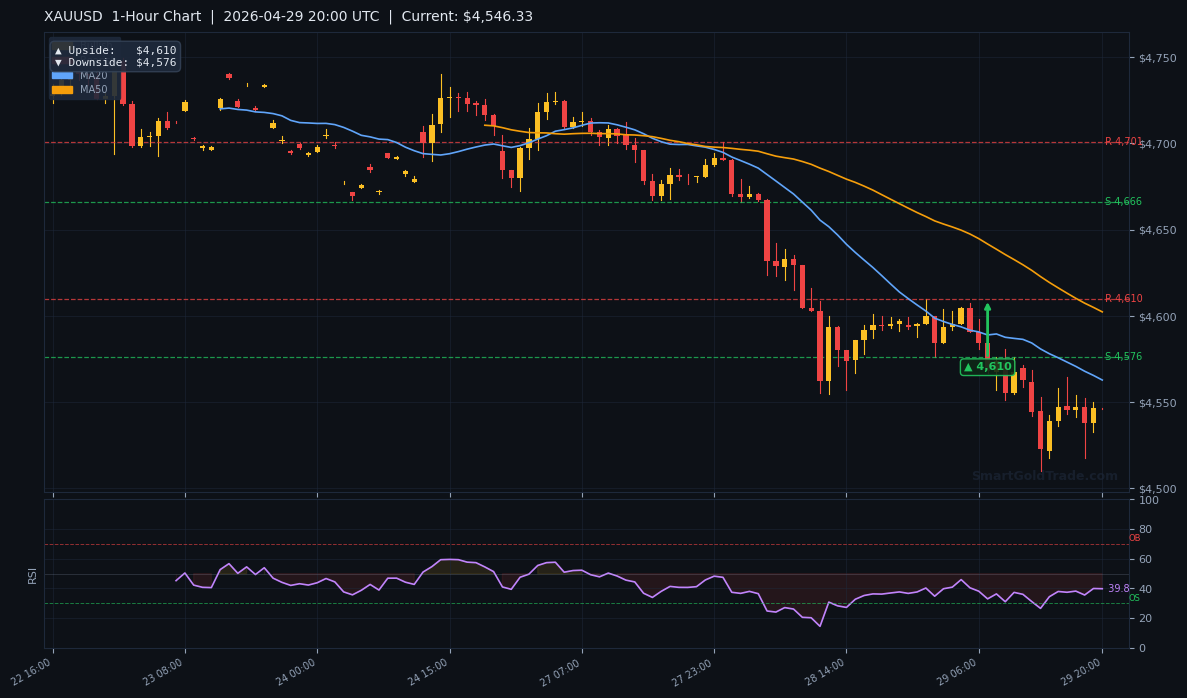
Support levels from the indicators: S1 $4,784.22 and S2 $4,745.01 — but note these are above current price, now acting as resistance levels. Resistance levels: R1 $4,868.16 and R2 $4,823.31. The 1-hour chart shows a downside pivot at $4,576 and upside pivot at $4,610. The 4-hour downside pivot is $4,703, upside $4,762. The daily downside pivot is $4,967. The ATR(14) of $22.36 gives an expected intraday range of roughly $4,525 to $4,570.
| Timeframe | Upside Pivot | Downside Pivot |
|---|---|---|
| 1-Hour | $4,610 | $4,576 |
| 4-Hour | $4,762 | $4,703 |
| Daily | $5,045 | $4,967 |
Fundamental Drivers
The only major piece of news on the radar is the delayed US Non-Farm Payrolls (NFP) report, originally scheduled for last Friday. The delay has kept traders cautious. Historically, NFP delays occur due to data collection issues or government logistics — they often precede a volatile catch-up when the report finally hits. The market expects payrolls to have softened, which could be marginally bullish for gold price, but the delayed release also raises uncertainty.
Key Event to Watch
The delayed NFP report is now expected on Thursday or Friday this week. A weaker-than-expected number would put downward pressure on the dollar and lift gold. However, if the data surprises to the upside, gold could break below $4,576 quickly. For traders using automated systems, consider using news event trading protection to pause orders during the release.
Devil's Advocate
What could invalidate the bearish bias? A sudden dollar sell-off or a geopolitical flash event could trigger a short squeeze. If gold reclaims the 1-hour upside pivot of $4,610 on strong volume, the bearish scenario weakens. A daily close above $4,645 (MA20) would flip the medium-term trend to neutral. Conversely, a break below $4,576 with increased ATR would confirm a new leg down targeting $4,703 on the 4-hour chart.
Trading Strategy for American Session
For intraday bears: Look to sell into rallies towards $4,576–$4,590 zone. Place stop loss above $4,610 (1-hour upside pivot) or a fixed $22 ATR-based stop at $4,612. First take profit at $4,540, second at $4,525 (lower edge of ATR range). For aggressive bears, a break and retest of $4,576 offers a short entry targeting $4,540.
For contrarian bulls: A bounce from $4,576 with a bullish engulfing candle on the 15-minute chart could be scalped to $4,600. But given the trend, bullish trades carry high risk. Traders who prefer ethical, interest-free exposure can explore halal gold trading through physical ownership instead of leveraged CFDs.
Key Takeaways
- Gold price at $4,547 is below all major moving averages — bearish structure.
- RSI at 30.7 is near oversold but not yet triggering a reversal signal.
- Immediate support at 1-hour downside pivot $4,576 — a break opens door to $4,703.
- Key resistance for any recovery: $4,610 (1H pivot) and $4,645 (MA20).
- Delayed NFP report this week is the biggest fundamental risk — weak data could lift gold, strong data could accelerate sell-off.
- ATR of $22.36 suggests a normal daily range of ~$45 — currently price is near the lower band.
Conclusion
The gold price is trapped in a bearish technical setup with no immediate catalyst for a reversal. Bulls are standing aside, and the delayed NFP adds a layer of uncertainty that typically favours sellers until data is released. The critical level to watch tonight is $4,576. A breakdown would shift the next target to $4,703, while a bounce might offer a minor retracement toward $4,610. Trade carefully — the trend is your friend, but false breaks can trap the impatient.
Frequently Asked Questions
- Why is gold price falling today?
- Gold is under pressure due to a stronger US dollar, elevated Treasury yields, and pre-NFP positioning. The technical breakdown below all major moving averages has accelerated selling.
- What is the next support for gold?
- The immediate support is the 1-hour downside pivot at $4,576. Below that, the 4-hour downside pivot at $4,703 becomes the next major target.
- Could the NFP report reverse the gold price?
- Yes, if the delayed NFP shows weaker-than-expected job growth, the dollar could fall and gold could rally back above $4,610. A strong number would confirm the bearish trend.
- Is it safe to buy gold at current levels?
- No, buying into a falling knife is risky. Wait for a confirmed bounce above $4,576 or a reversal candlestick pattern. The trend is bearish until gold reclaims the MA20 at $4,645.
- What is the daily expected range for gold?
- Based on the ATR of $22.36, the normal range is roughly $4,525 to $4,570. Current price near the lower end suggests potential for a bounce or breakdown.
Trading Gold (XAU/USD) carries significant risk of loss and is not suitable for all investors. This content is for informational purposes only and does not constitute financial advice. Always conduct your own research and trade responsibly.