The gold price is trading at $4,584 during the American session on April 28, 2026, under pressure from a strengthening US Dollar. The USD/CHF pair edged up 0.15% as risk appetite improved, pulling the Greenback off its daily lows. This dollar recovery has capped any bullish attempts in gold, with the metal struggling to reclaim higher ground above $4,600.
Traders should watch for further downside as long as the dollar maintains this bounce. The absence of fresh economic data leaves gold vulnerable to technical selling. This session, the focus remains on how far the dollar recovery can extend.
Gold Price at $4,584: Technical Breakdown for American Session
Macro Context
The US Dollar Index (DXY) is recovering from session lows, driven by improved risk sentiment across equity markets. With no major US economic data released today, the dollar's move is more technical and sentiment-driven. Gold remains inversely correlated, and the recent drop below the $4,600 support zone has accelerated selling pressure.
Traders should note that the absence of fresh fundamentals leaves price action reliant on technicals and dollar dynamics. The USD/CHF bounce from 0.7840 to 0.7854 reflects a broader shift in risk appetite.
Session Outlook
During the American session, liquidity is high, and gold could see further erosion if the DXY builds on its bounce. The key range to watch is between $4,560 and $4,620. A break below $4,560 could open the door to $4,500, while a recovery above $4,620 would signal short-term bullish reversal.
Given the current price at $4,584, the bias is bearish below $4,600. Watch for intraday resistance near $4,615 – the level of previous hourly rejections.
Technical Analysis
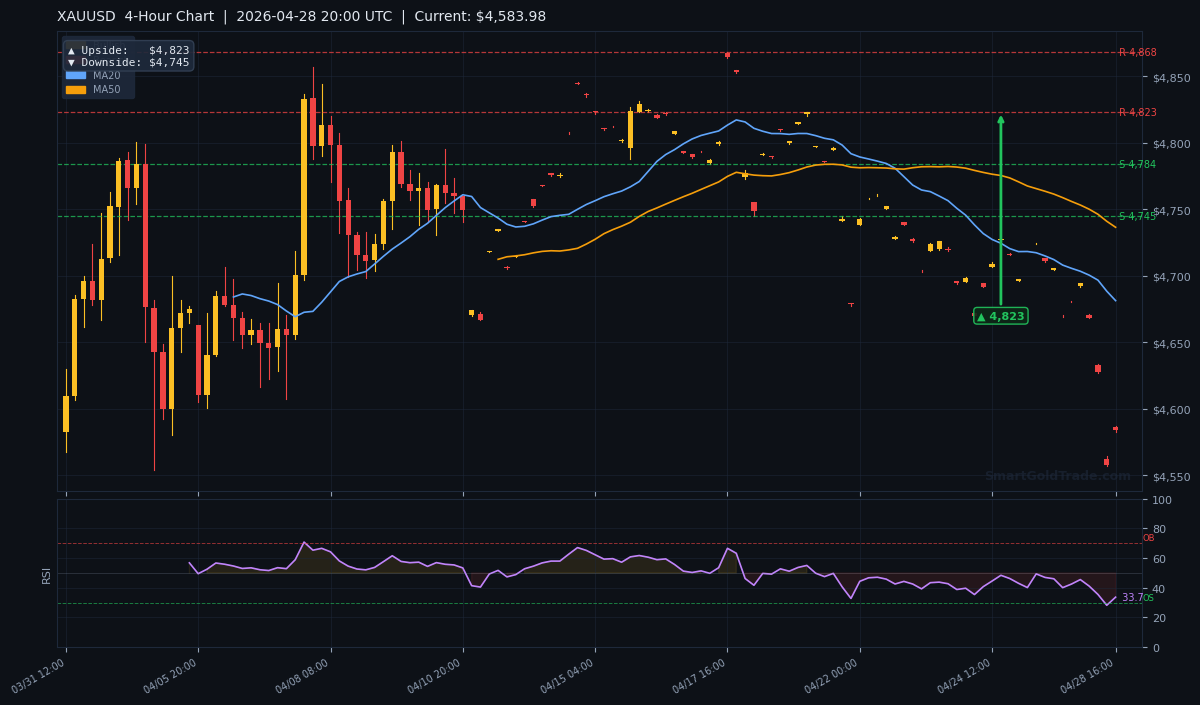
Gold's technical structure on the 4-hour timeframe reinforces the bearish bias. The current price at $4,583.98 sits well below all major moving averages. The MA20 (short-term) at $4,681.36, MA50 (mid-term) at $4,736.50, and MA200 (long-term) at $4,711.84 all act as distant resistance. This confirms a bearish alignment with MA20 below MA50, indicating sustained downward pressure.
Moving Average Structure
The moving average cascade is clearly bearish. Price is below all three key MAs, and the short-term MA20 is below the MA50 – a classic sign of weakness. Until price reclaims the MA20 at $4,681, any rally is likely to be capped.
RSI and Momentum
The RSI(14) reads 33.7, which is in neutral territory – not oversold yet, so room for further decline remains. Traders should not interpret RSI at 33 as an automatic buy signal. Momentum indicators still point lower.
Key Price Levels
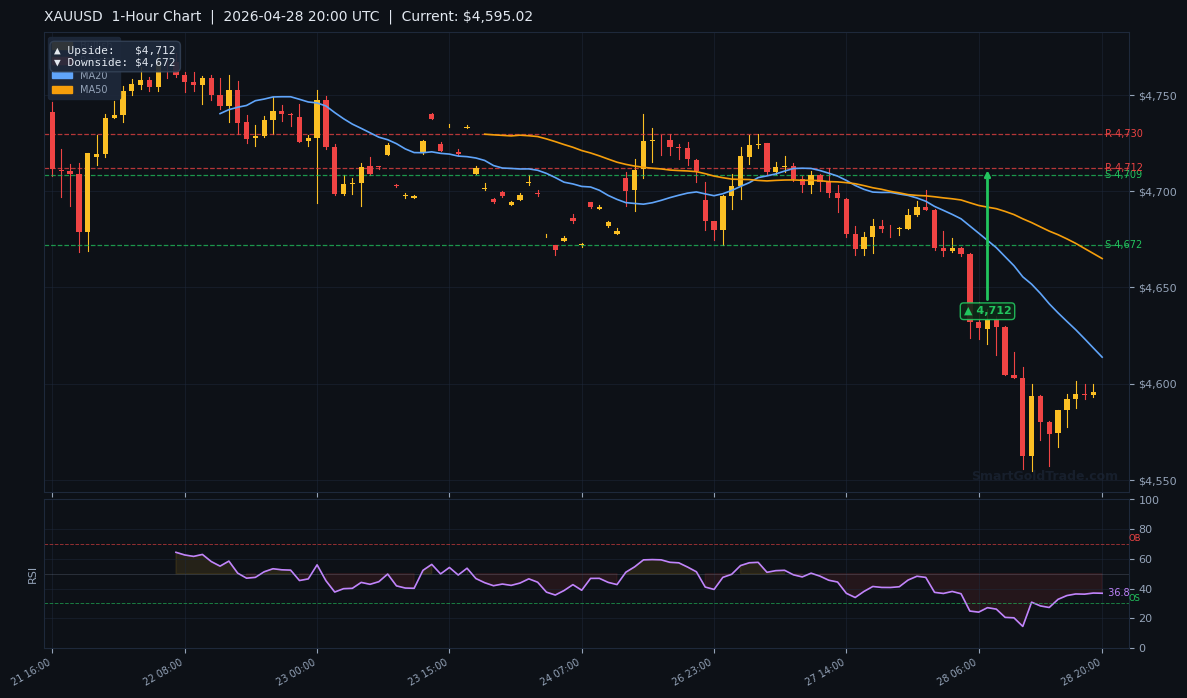
Support S1 at $4,787.61 and S2 at $4,784.22 are now overhead supply zones, as price has broken below them. Resistance levels are R1 at $4,868.16 and R2 at $4,831.27. However, these are far above current price, highlighting extreme bearish momentum. The daily pivot targets from chart analysis show upside target at $5,045 and downside target at $4,996, both extremely distant, suggesting that any bounce could be sharp but likely corrective. The 4-hour and 1-hour targets are closer: 4H upside $4,823, downside $4,745; 1H upside $4,712, downside $4,672. The ATR(14) at $25.84 suggests a typical daily range of about $50, aligning with recent volatility.
Fundamental Drivers
The primary driver today is the dollar's intraday recovery. The USD/CHF bounce from 0.7840 to 0.7854 reflects improved risk appetite, which historically weighs on gold as an alternative safe haven. No major US economic releases were scheduled for today, so gold's moves are largely technical and tied to dollar momentum.
The absence of new Fed speakers or geopolitical triggers leaves gold vulnerable to algorithmic selling as long as key resistance levels hold. Traders using automated tools can benefit from professional gold trading signals to stay ahead of sudden moves.
Key Event to Watch
This week, traders will focus on the upcoming FOMC meeting decision on May 2. Any hawkish surprise could further strengthen the dollar and push gold toward $4,500. Conversely, a dovish tone could trigger a relief rally back to $4,700. For those seeking a managed approach, Islamic profit-sharing investment plans offer a way to participate in gold markets without active trading.
Devil's Advocate
If gold manages to reclaim the $4,620 level and close above it on the hourly chart, it could invalidate the bearish bias. A deeper dollar pullback or a risk-off event would also support gold. The key reversal level is the broken support-turned-resistance at $4,787 – a move above that would signal a trend shift, but such a rally is unlikely without a major catalyst.
Short-covering could fuel a quick pop to $4,650, but shorts will likely reload near resistance. The most probable path remains lower unless the dollar fails to hold its gains.
Trading Strategy for American Session
For aggressive traders, a sell-on-rally strategy is favored. Entry zone: $4,600–$4,615 (the area of recent hourly resistance). Stop loss: $4,641 (ATR-based, 1.5x daily ATR above entry). Take profit targets: TP1 at $4,560 (4H downside pivot), TP2 at $4,530 (psychological level). For conservative traders, wait for a break below $4,560 before shorting, targeting $4,500.
Position size should be moderate as volatility is elevated. Always use a stop loss. For those who prefer to follow expert trades, copy trading allows mirroring experienced gold traders automatically.
Key Takeaways
- Gold price at $4,584 faces bearish pressure from US Dollar bounce.
- Price is below all major moving averages – MA20 at $4,681, MA50 at $4,736, MA200 at $4,711.
- RSI(14) at 33.7 is neutral, not yet oversold.
- Key resistance: $4,600–$4,615; support: $4,560 and $4,500.
- ATR at $25.84 implies a daily range of about $50.
- FOMC meeting on May 2 is the next major catalyst.
Conclusion
To wrap up, the gold price remains under bearish pressure at $4,584 following the US Dollar's intraday bounce. The technical structure is firmly bearish with no signs of reversal yet. The key level to watch is $4,560 – a break below could accelerate losses toward $4,500. Traders should remain cautious and wait for clear signals before entering. Stay tuned for the FOMC decision later this week, which could redefine gold's trajectory.
Frequently Asked Questions
- What is the gold price today?
- The gold price is trading at $4,584 as of the American session on April 28, 2026.
- What are the key support levels for gold?
- Immediate support lies at $4,560, followed by $4,500. The next major level below that is $4,400.
- What does the RSI indicate for gold?
- The RSI(14) is at 33.7, which is neutral and not oversold, leaving room for further downside.
- What is the outlook for gold during this American session?
- The outlook is bearish with risk of a drop toward $4,560. A bounce above $4,620 would shift the bias neutral.
Trading Gold (XAU/USD) carries significant risk of loss and is not suitable for all investors. This content is for informational purposes only and does not constitute financial advice. Always conduct your own research and trade responsibly.