
The gold price is under heavy selling pressure this Monday, June 15, 2026, trading at $4,337.22 per troy ounce in early American dealing. A resurgent U.S. dollar and firmer Treasury yields are squeezing the metal toward make-or-break support. With the gold price trading below every major moving average, bears are eyeing a breakdown to the $4,300 round number—and possibly much lower.
Gold Price Market Overview
Macro Context
The US Dollar Index (DXY) extended its gains through the European session, climbing above 105.20 and keeping a lid on dollar-denominated assets. At the same time, the 10-year Treasury yield ticked up to 4.40%, reducing the appeal of non-yielding gold. The market has fully priced in a hawkish hold at this week’s FOMC meeting, and any hint of a delayed rate cut could push the gold price deeper into bearish territory. Lingering geopolitical jitters from the Red Sea have not been enough to trigger fresh safe-haven bids.
Session Outlook
Liquidity was thin during the Asian overlap, but the New York open brought renewed selling. The average true range over the last 14 periods (ATR) sits near $25, suggesting a typical daily range of $4,310 to $4,360 for the gold price today. Should sellers push below $4,300, momentum could accelerate toward the next major floor at $4,270. A move above the $4,365 pivot would be needed just to stabilize the immediate decline.
Gold Price Technical Analysis
Moving Average Alignment
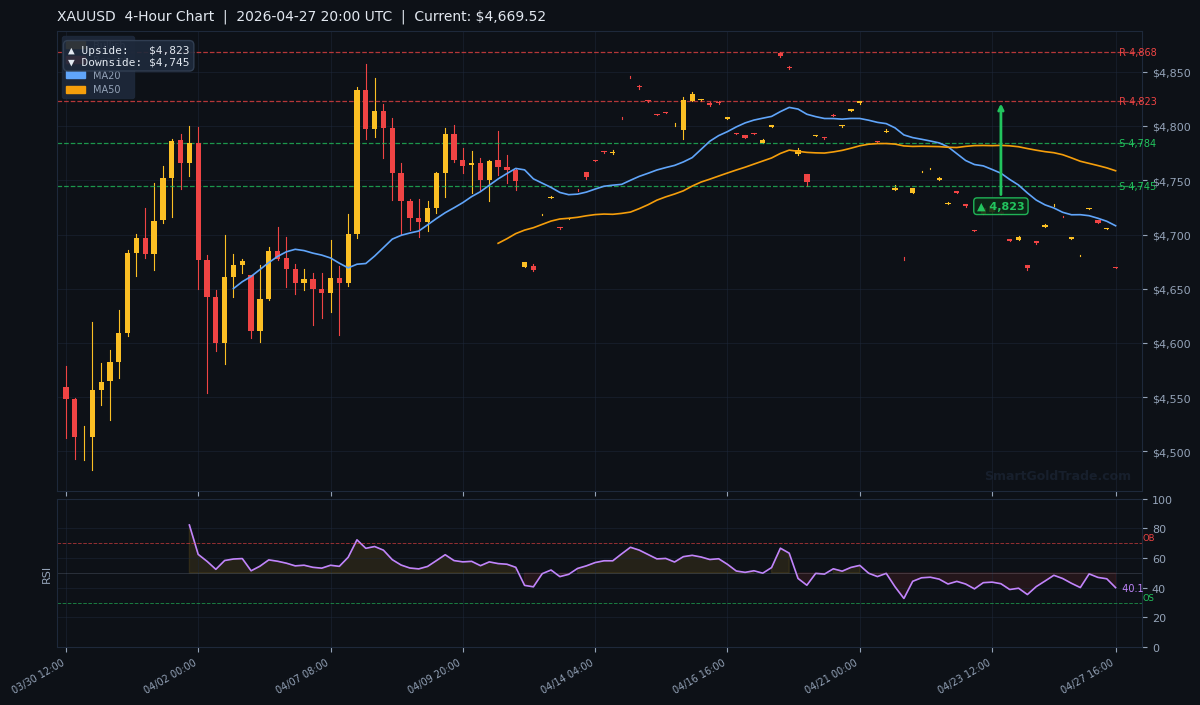
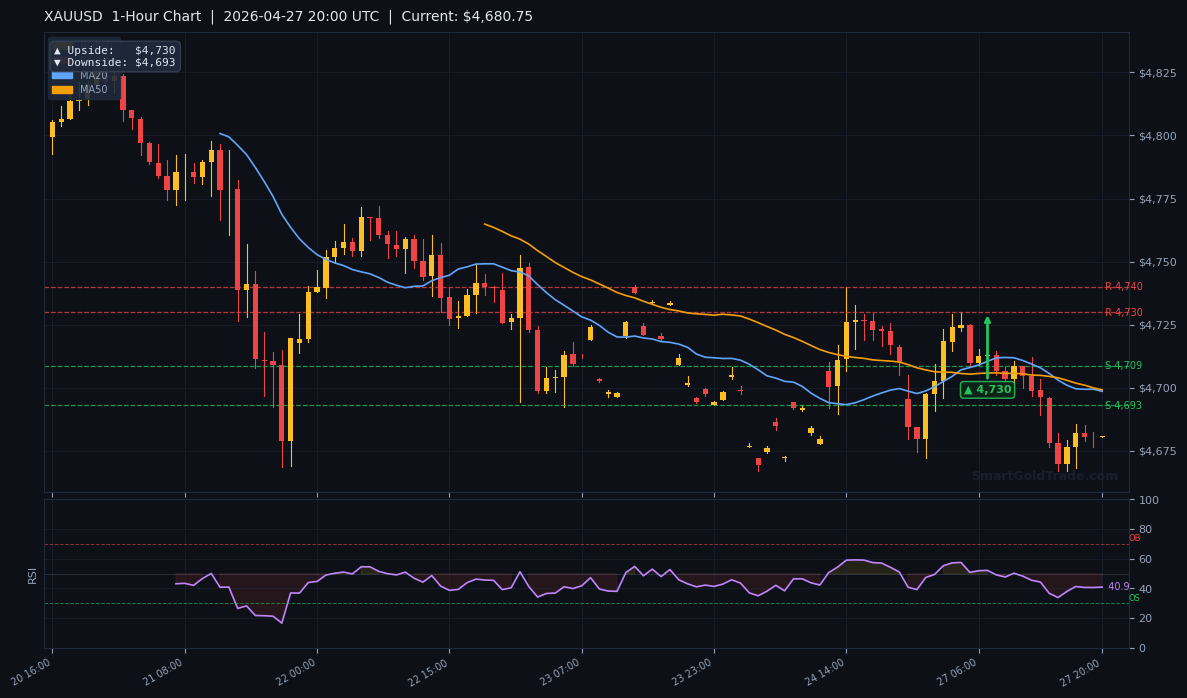
The 20-period simple moving average (MA20) rests at $4,375.55, the MA50 at $4,445.20, and the MA200 at $4,410.80. With the spot gold price at $4,337.22, it sits below all three averages—a classic bearish death cross setup on the hourly chart. The gap between the MA20 and MA50 continues to widen, reinforcing the downside momentum.
RSI and Momentum
The RSI(14) reads 42.3, holding in neutral territory but sloping lower. There’s still room before the indicator reaches the oversold 30 line, which means sellers are not yet exhausted. No bullish divergence has appeared on the 1-hour or 4-hour charts, keeping the bias tilted firmly to the downside.
Key Support and Resistance Levels
- Resistance R1: $4,375 – the MA20 and the session’s first hurdle for any bounce.
- Resistance R2: $4,410 – confluence of the MA200 and prior swing low from last week.
- Support S1: $4,300 – psychological round number that held on two previous tests this month.
- Support S2: $4,270 – the low from the June 10th flash crash, a critical structural floor.
Daily pivot calculations place the central pivot at $4,350, with an intraday resistance at $4,392 and support at $4,308. A close below the daily S1 would open the door to a retest of $4,270.
Fundamental Drivers
Monday’s calendar offers no high-impact U.S. data, leaving the gold price to trade purely off sentiment and positioning ahead of Wednesday’s FOMC decision. Last week’s hotter-than-expected CPI print cemented fears that the Fed will stay restrictive. Meanwhile, reports of central bank gold purchases have slowed, removing a backstop that had cushioned pullbacks earlier in the year.
FOMC Decision – the Main Event
All eyes turn to the Federal Reserve’s statement and Chair Powell’s press conference on Wednesday, June 17. If Powell pushes back firmly against near-term rate cut expectations, real yields could climb further and sink the gold price below $4,300. On the other hand, a surprise dovish tilt—perhaps acknowledging cracks in the labor market—might spark a violent short-covering rally toward $4,375. For now, the fundamental backdrop favours the bears, and the gold price is struggling to find a friend.
Devil’s Advocate – Bullish Reversal Scenarios
What could flip this bearish picture? First, a 1-hour close above the $4,375 MA20 would halt the downtrend and hint at a double bottom on the hourly chart. Second, if the DXY retreats sharply below 104.80, the gold price could mount a recovery toward the $4,410 resistance zone. The $4,350 mid-point will be the initial acid test—any sustained trading above that level would signal that sellers are losing grip. A shift in Fed tone on Wednesday remains the wildcard that could quickly rewrite the technical script.
Gold Price and Shariah-Compliant Investment
For Muslim investors, the direction of the gold price is only half the story—how you trade or invest matters just as much. Shariah law prohibits riba (interest) and highly speculative contracts, which rules out conventional leveraged forex and CFD brokers. Instead, you can trade gold through a fully halal spot platform that ensures physical ownership and zero overnight fees. SmartGoldTrade’s halal gold trading service offers interest-free, gram-lot trading with direct market access—keeping your trades shariah-compliant from entry to exit. For those who prefer tangible assets, it’s easy to purchase physical gold coins and bars directly from the store, securing 24K bars or 22K coins as a long-term store of value.
Trading Strategy for Monday’s Session
Aggressive sellers can look for entries on a retest of the $4,365–$4,375 resistance band, placing a stop loss just above $4,410 (the MA200). The first take-profit target sits at $4,300, with a second target at $4,270 if the breakdown gains momentum. Using the ATR of $25, a trailing stop of roughly $12–$15 once the trade moves 50% of the way to target can lock in gains.
Conservative traders may prefer to wait for a confirmed break below $4,300 on a high-volume 15-minute candle before entering short. This approach sacrifices some pips for a cleaner signal and lower whipsaw risk. Avoid fighting the trend with long positions until the gold price reclaims the $4,375 pivot—buying into a falling knife in a bearish MA structure rarely ends well.
While this technical roadmap gives you a framework, many traders sharpen their edge by following institutional-grade setups. For real-time entry, stop-loss, and take-profit alerts that align with the levels discussed, you can explore professional gold trading signals to complement your analysis.
Key Takeaways
- The gold price trades at $4,337.22, below all major moving averages—bearish structure confirmed.
- RSI of 42.3 gives sellers room to push lower before oversold conditions emerge.
- Immediate resistance stands at $4,375 (MA20) and $4,410 (MA200); support at $4,300 and $4,270.
- ATR of $25 suggests a typical intraday range between $4,310 and $4,360.
- Wednesday’s FOMC decision on June 17 is the pivotal catalyst; a hawkish hold could break the gold price below $4,300.
- Shariah-compliant investors can access the gold price through halal spot trading or physical ownership, avoiding riba and leverage.
Conclusion
The gold price is at a moment of truth. Technically, the path of least resistance is lower, with bears firmly in control below the $4,375 threshold. The $4,300 support will be the line in the sand—lose it, and a slide toward $4,270 becomes the base case. With the FOMC meeting just two days away, volatility is guaranteed, so position sizing and disciplined risk management are essential. Whether you’re trading the gold price for short-term gains or accumulating physical bullion for the long haul, staying informed and agile will make all the difference.
FAQ
- Why is the gold price falling today?
- The gold price is retreating because the U.S. dollar is strengthening and Treasury yields are climbing ahead of a widely expected hawkish FOMC hold. Technical selling intensified after gold broke below the $4,375 MA20 support.
- What is the next support for the gold price?
- Immediate support is at $4,300, a psychological round number. A break below that would expose the $4,270 level, which is the low from the sharp drop on June 10.
- Can the gold price bounce back above $4,400 this week?
- A bounce above $4,400 is unlikely unless the FOMC surprises with a dovish statement. The first major resistance is $4,375, and a clear break above that would be needed to set the stage for a move toward $4,410.
- What’s the best strategy for trading the gold price today?
- Selling on rallies to the $4,365–$4,375 zone with a stop above $4,410 and targets at $4,300 and $4,270 offers a high-probability setup. Avoid longing until the gold price reclaims the $4,375 MA20.
Trading Gold (XAU/USD) carries significant risk of loss and is not suitable for all investors. This content is for informational purposes only and does not constitute financial advice. Always conduct your own research and trade responsibly.