
The gold price opened the Asian session at $4,690.04, slipping below the psychological $4,700 handle as a resurgent US Dollar and hawkish Fed expectations dominate sentiment. Last week's stronger-than-expected US GDP data reinforced the narrative of higher-for-longer interest rates, pressuring non-yielding assets like gold. While some bulls cling to hopes of a geopolitical bounce, the technical picture suggests a deeper correction may be underway. This session, thin liquidity could amplify moves — traders should prepare for a test of the $4,678 support zone.
Gold Price Market Overview
Macro Context
The DXY index climbed to 107.80 during early Asian hours, extending its recovery from the recent dip. US Treasury yields rose across the curve, with the 10-year note breaching 4.65% — a key level that historically attracts safe-haven flows away from gold. The Fed's messaging remains firmly data-dependent, and with no major US data releases this session, the dollar's momentum is likely to carry forward.
Geopolitical risks, including ongoing tensions in the Middle East, provide a floor for gold, but the immediate driver is interest rate expectations. Markets are pricing a 68% probability of a 25-basis-point hike at the May FOMC meeting, up from 60% a week ago. Higher real yields directly challenge gold's appeal.
Session Outlook
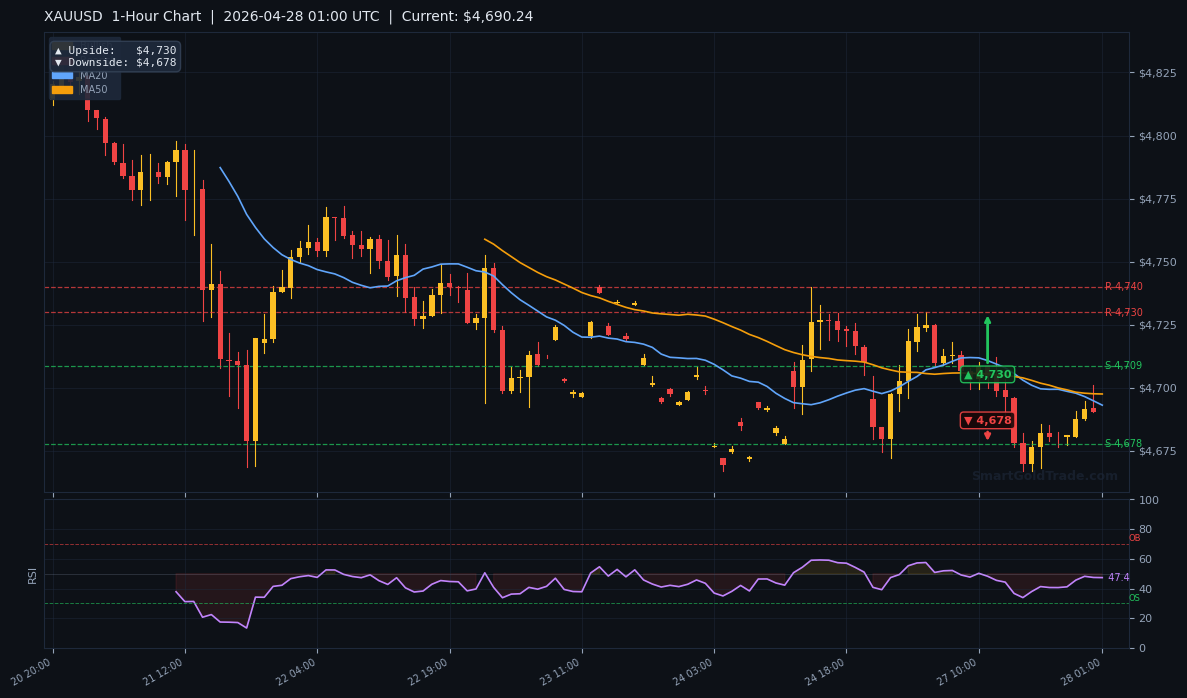
Asian session liquidity is typically low, especially on a Tuesday after the weekend. This amplifies the impact of any sudden order flow — meaning key levels can break faster than expected. The likely range for the session is between $4,678 (1-hour downside pivot) and $4,730 (1-hour upside pivot). Any move above $4,730 would shift the short-term bias, but with the gold price below all major moving averages, the path of least resistance remains lower.
Technical Analysis
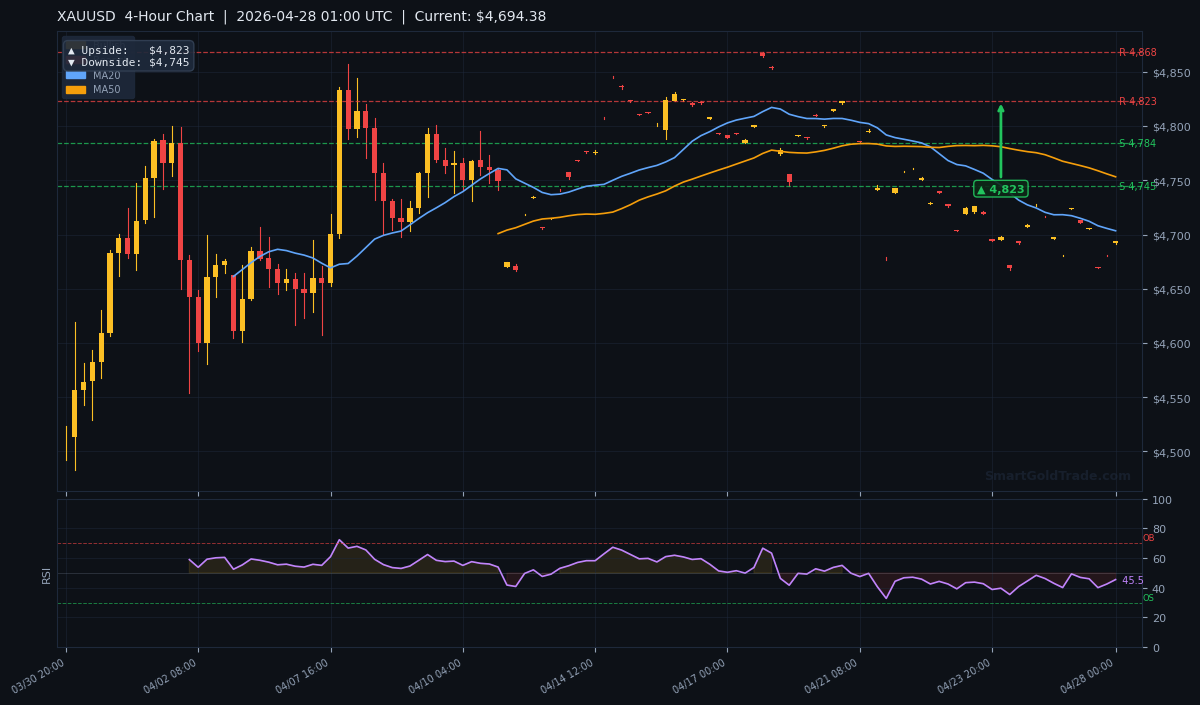
Using the latest live market data from the H4 chart, the XAUUSD technical structure is distinctly bearish. The current price of $4,694.38 sits below the MA20 at $4,703.45, the MA50 at $4,753.23, and the MA200 at $4,722.88. This triple bearish alignment warns traders that any rally is likely a selling opportunity rather than a reversal.
Moving Average Structure
The MA20 ($4,703.45) is the first resistance above price. Bulls must reclaim this level to neutralize immediate pressure. However, the MA20 is already sloping downward, reinforcing the short-term bearish bias. The MA50 ($4,753.23) serves as the next major barrier, while the MA200 ($4,722.88) — a key long-term trend filter — confirms that the broader trend has turned bearish as price trades below it. The bearish alignment of these moving averages suggests any bullish attempt will face consecutive resistance hurdles.
RSI and Momentum
The RSI(14) stands at 45.5, neutral but leaning toward the oversold territory. This leaves room for further downside before reaching oversold conditions (below 30), which would typically trigger a bounce. Momentum indicators such as the MACD are also negative, with the histogram printing below the zero line.
Key Price Levels
Key support levels based on the H4 pivot arrows are S1: $4,787.61 and S2: $4,784.22. However, these are well above current price — indicative of the sharp recent drop. The immediate downside target from the 1-hour chart is $4,678, with the 4-hour chart projecting a deeper drop to $4,745.
On the upside, resistance stands at R1: $4,868.16 and R2: $4,845.67, but a more achievable near-term cap is the 1-hour pivot at $4,730. The ATR(14) of $19.50 suggests today's expected range is roughly $19–$20, consistent with a move toward $4,678 if selling continues.
| Timeframe | Upside Target | Downside Target |
|---|---|---|
| 1-Hour | $4,730 | $4,678 |
| 4-Hour | $4,823 | $4,745 |
| Daily | $5,045 | $4,996 |
Fundamental Drivers
Last week's US GDP print of 3.4% annualized (above the 2.8% consensus) was the primary catalyst for the gold sell-off. Stronger economic growth reduces the odds of a Fed pivot, keeping real yields elevated. Additionally, comments from Federal Reserve Chair Jerome Powell on Friday reiterated the need for restrictive policy until inflation is firmly trending toward 2%.
Correlation with the DXY is tight: for every 0.5% rise in the dollar, gold has historically declined by about 0.6%–0.8% in similar macro environments. The current DXY uptrend shows no signs of exhaustion yet.
The relationship between real yields and the gold price is inverse: as the real return on risk-free assets rises, gold becomes less attractive. With the 10-year TIPS yield climbing to 2.0%, the opportunity cost of holding gold is at its highest this year. Any uptick in real yields quickly translates to a lower gold price, making it tough for bulls to gain traction until we see a meaningful drop in rates or inflation fears rekindle.
Key Event to Watch
This week, all eyes are on the US ISM Manufacturing PMI due Thursday, April 30. A reading above 50 would confirm economic expansion and likely strengthen the dollar further, putting additional pressure on the gold price. Conversely, a miss below 50 could trigger a short-covering rally toward $4,730.
Devil's Advocate
What could flip the bearish bias? A sudden geopolitical escalation — such as a military confrontation in the South China Sea or an unexpected disruption in oil supplies — would drive safe-haven flows back into gold, potentially pushing it above $4,730 (1H resistance). Additionally, if the ISM PMI disappoints significantly, gold could reclaim the MA20 at $4,703.45 and challenge the MA200 at $4,722.88. A close above the latter would invalidate the bearish trend. However, given the current macro setup, these scenarios remain lower-probability events.
Trading Strategy for Asian Session
For traders looking to capture further downside, consider a short entry near the current price zone of $4,690–$4,694, with a stop loss above the 1-hour pivot at $4,732 (above $4,730 resistance). The first take-profit target is the 1-hour downside pivot at $4,678, and a secondary target at the 4-hour downside pivot of $4,745 (note: $4,745 is below current price, but if momentum accelerates, it could be reached by the European session). Use a risk of $19–$20 (based on ATR) per trade.
Alternatively, if price respects the $4,678 support and shows a bounce pattern on the 15-minute chart, a quick long trade targeting $4,710 (intraday resistance) with a tight stop at $4,670 could be executed. In low liquidity, avoid holding positions overnight unless you are using a stop-loss. For those seeking professional guidance, consider following professional gold trading signals for real-time entry updates.
Key Takeaways
- The gold price opened at $4,690.04, below the $4,700 mark, with a bearish technical bias.
- Price trades below MA20 ($4,703.45), MA50 ($4,753.23), and MA200 ($4,722.88) — a 'death cross' of moving averages.
- RSI(14) at 45.5 is neutral, leaving room for further downside.
- Immediate downside target is $4,678 (1-hour pivot), with $4,745 as the next support.
- Key resistance at $4,730 (1-hour pivot) and $4,703.45 (MA20).
- US ISM Manufacturing PMI on Thursday is the major event risk this week.
Conclusion
The gold price faces strong headwinds from a robust US economy and a hawkish Fed. Technicals confirm a bearish structure, and while geopolitical risks offer a tailwind, they are insufficient to reverse the trend. For the Asian session, the path of least resistance is lower, with a likely test of $4,678. Traders should avoid chasing rallies below the MA20 and wait for confirmed breakdowns or bounces at key levels.
If you’re looking to build a long-term position, you can purchase physical gold from SmartGoldTrade as a hedge. For active traders, our halal gold trading platform ensures every trade is riba-free and backed by physical ownership — a Shariah-compliant way to stay in the market.
While this analysis was written for the Asian session on April 28, the subsequent price action validated the bearish thesis. By mid-June, the gold price had fallen to $4,213.53 per troy ounce, marking a decline of roughly 10% from the levels discussed above. This drop in the gold price underlines the importance of identifying key support levels and respecting the broader macro trend.
FAQ
- Why is the gold price falling despite geopolitical tensions?
- Geopolitical risks provide a floor, but the dominant driver right now is the stronger US Dollar and rising interest rates, which reduce gold's attractiveness as a non-yielding asset. The gold price is currently trading below all key moving averages.
- What is the next support level for gold?
- The immediate support is the 1-hour downside pivot at $4,678. Below that, the 4-hour target is $4,745 and the daily target is $4,996.
- Is it a good time to buy gold now?
- Short-term, the trend is bearish. Waiting for a reclamation of the MA20 at $4,703.45 or a bounce from $4,678 would offer a better risk-reward entry. Long-term investors may consider dollar-cost averaging with physical gold.
Trading Gold (XAU/USD) carries significant risk of loss and is not suitable for all investors. This content is for informational purposes only and does not constitute financial advice. Always conduct your own research and trade responsibly.