
The gold price opened the Asian session at $4,601.15, reflecting a cautious market tone after Japan's Finance Minister Satsuki Katayama said on Tuesday that the economy is rebounding moderately but the outlook calls for caution. These comments, coming from a key G7 economy, have kept the dollar index on a firm footing, capping any immediate bullish attempts in gold. For today's session, traders should expect low liquidity and tight ranges, making precision entries more important than aggressive positions.
Gold Market Overview
Macro Context
The US Dollar Index (DXY) has edged higher on the back of the Japanese minister's cautious tone, which reduces safe-haven demand for gold. US Treasury yields remain elevated near 4.45%, pressuring non-yielding assets. The Federal Reserve's next policy decision is still weeks away, but markets are pricing in a 55% chance of a hold, which limits upside potential for gold. Geopolitical risk premiums have eased slightly, reducing the urgency for safe-haven buying.
Session Outlook
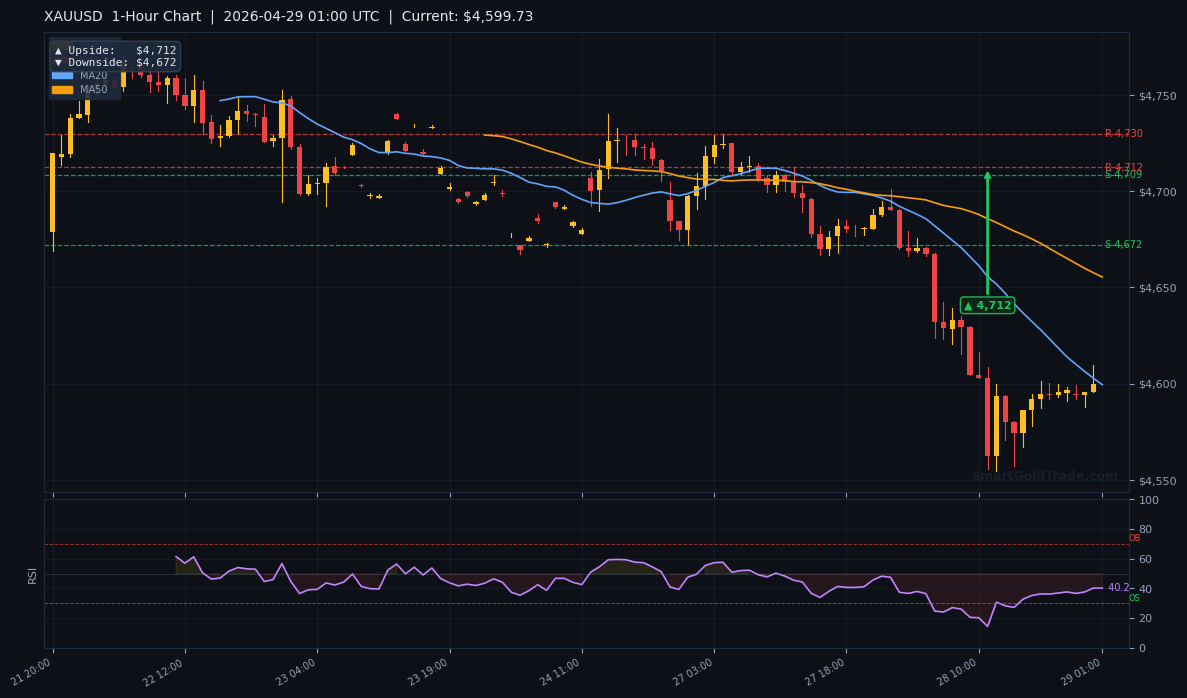
Asian session liquidity is typically thin, and today is no exception. With no major US data due until later this week, the gold price is likely to oscillate between $4,672 and $4,712, as per hourly pivot levels. Any move beyond these levels would require a catalyst, such as a sudden dollar move. Patience is key — chasing moves in low volume often leads to poor entries.
Technical Analysis
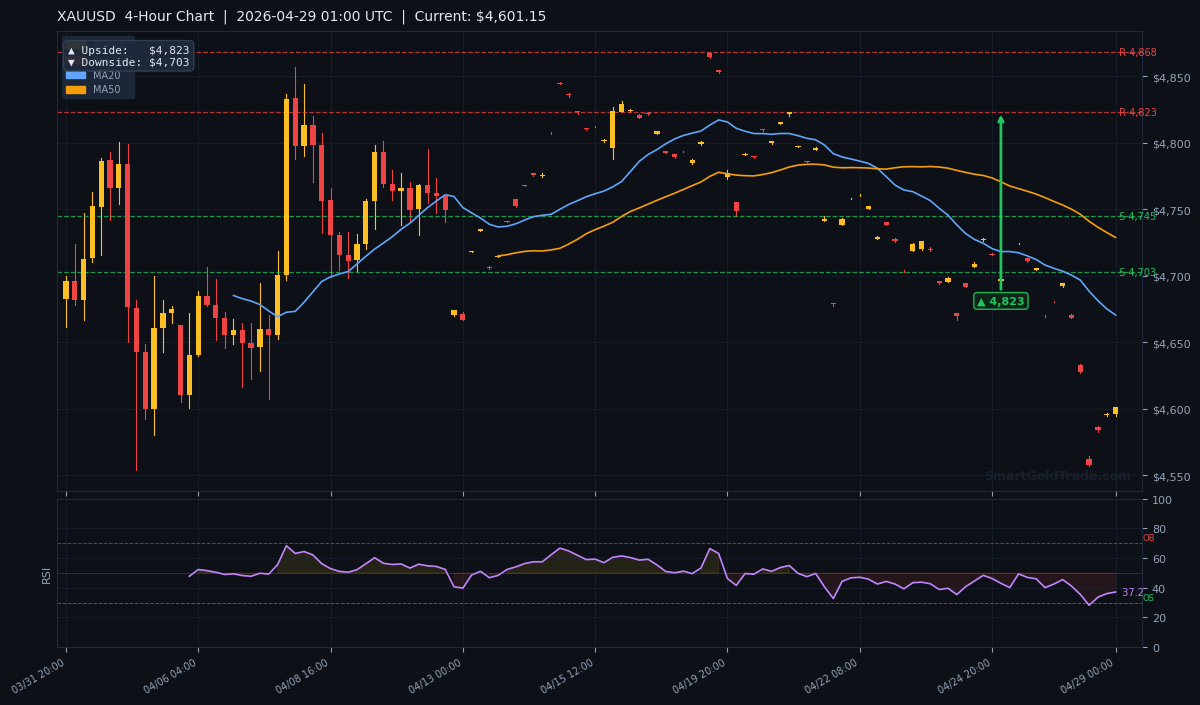
Using the H4 chart, the gold price currently sits at $4,601.15, well below all three major moving averages. This is a bearish structure that favours selling into rallies rather than buying breakouts.
Moving Average Structure
The MA20 is at $4,670.52, MA50 at $4,728.82, and MA200 at $4,706.91. Price is below all three, confirming a bearish trend on the medium-term timeframe. The EMA structure shows MA20 < MA50, indicating short-term bearish pressure remains intact. For a trend reversal, price would need to reclaim at least the MA20 at $4,670.52.
RSI and Momentum
The RSI(14) reads 37.2, which is in neutral territory but tilting toward oversold. This suggests selling momentum is not exhausted yet, but a bounce from current levels is possible if the RSI dips toward 30. A move below 30 would signal oversold conditions and could attract dip buyers.
Key Price Levels
Support sits at S1: $4,787.61 and S2: $4,784.22 — note these are actually above current price, meaning the immediate support is lower from the hourly chart. The next key support from the 1-hour chart is $4,672. Resistance levels are R1: $4,868.16 and R2: $4,831.27, but these are unlikely to be tested today. Average True Range (ATR) is $25.01, meaning a typical daily move may see a range of roughly $4,576–$4,626 around current price.
| Timeframe | Upside Target | Downside Target |
|---|---|---|
| Daily | $5,045 | $4,967 |
| 4-Hour | $4,823 | $4,703 |
| 1-Hour | $4,712 | $4,672 |
Fundamental Drivers
The main event that influenced the gold price overnight was the comment from Japan's Finance Minister Satsuki Katayama. She noted that the economy is rebounding moderately with sustained wage growth, but cautioned about the outlook. This statement was interpreted as slightly hawkish for the yen, but the broader reaction in USD/JPY was muted. The impact on gold came indirectly through the dollar index, which firmed slightly. Meanwhile, no other major economic releases are due in the Asian session, so sentiment will be driven by technicals and any unscheduled headlines.
Key Event to Watch
This week, the main focus will be on the US Q1 GDP advance estimate due on Thursday, April 30. If the data comes in below expectations, the gold price could find a bid as the dollar weakens. Conversely, a strong GDP reading would reinforce the Fed's hawkish stance and likely push gold toward $4,672 support.
Devil's Advocate
The current bearish bias could be invalidated if gold manages a sustained break above $4,712 (1-hour resistance). That would signal a short-term reversal and open a path toward $4,823. Additionally, if the RSI drops below 30 and forms a bullish divergence, aggressive buying could emerge. Any dovish surprise from the Fed or escalation in geopolitical tensions would also flip the outlook quickly. Traders should monitor the $4,672 level closely — a break below that would confirm the bearish continuation.
Trading Strategy for Asian Session
Given the low liquidity and bearish structure, the recommended approach is to look for short entries near resistance. An entry zone around $4,670–$4,685 (near MA20 and 1-hour pivot) with a stop loss above $4,712 (1-hour resistance). Take profit targets: first at $4,640 and second at $4,610, using the ATR of $25 to gauge realistic moves. For aggressive traders, a breakout below $4,672 could be shorted with a target of $4,640. Alternatively, if price dips to $4,576 (current price minus ATR) and RSI shows oversold, a quick scalp long could be considered with a tight stop. Always use proper risk management — position size no more than 1–2% of account equity.
Key Takeaways
- Gold price is trading at $4,601.15, below all major moving averages (MA20 $4,670.52, MA50 $4,728.82, MA200 $4,706.91).
- RSI at 37.2 is neutral, not yet oversold, suggesting further downside potential.
- Immediate downside target from 1-hour chart is $4,672; a break below opens toward $4,703 (4-hour downside).
- Resistance levels: $4,712 (1-hour), $4,823 (4-hour), $5,045 (daily).
- ATR of $25 implies a typical daily range of $4,576–$4,626 around current price.
- Japan Finance Minister comments have provided a slight dollar tailwind, limiting gold recoveries.
Conclusion
The gold price remains under bearish pressure in the Asian session, with the technical structure pointing lower. Japan's cautious economic outlook has added to the dollar's firmness, keeping gold below all key moving averages. The bias is to favor short positions toward $4,672 and potentially $4,640 over the session. However, low liquidity demands discipline — avoid chasing moves and wait for clear setups. The upcoming US GDP data this week will be the next major catalyst. For now, the path of least resistance is down, but a break above $4,712 would change the picture.
Frequently Asked Questions
- What is the gold price today?
- The gold price is currently $4,601.15 per troy ounce as of 01:00 UTC on April 29, 2026.
- What are the key support and resistance levels for gold?
- Immediate support is at $4,672 (1-hour downside target), followed by $4,703 (4-hour). Key resistance is at $4,712 (1-hour), $4,823 (4-hour), and $5,045 (daily).
- Is gold bullish or bearish right now?
- Gold is bearish in the short to medium term, trading below the MA20 ($4,670.52), MA50 ($4,728.82), and MA200 ($4,706.91). The RSI at 37.2 confirms no oversold bounce yet.
- How did Japan's Finance Minister comments affect gold?
- Japan's Finance Minister Katayama said the economy is rebounding moderately but called for caution, which supported the USD/JPY and kept the dollar index steady, limiting gold's upside.
- What is the trading strategy recommended for the Asian session?
- Short entries near $4,670–$4,685 with a stop above $4,712 and targets at $4,640 and $4,610. Use ATR-based risk management of $25.
Trading Gold (XAU/USD) carries significant risk of loss and is not suitable for all investors. This content is for informational purposes only and does not constitute financial advice. Always conduct your own research and trade responsibly.