
Gold Price Momentum Stalls at $4,570 — $4,666 Support the Line
The gold price is trading at $4,569.02 as the European session opens on April 29, 2026. Momentum from last week’s decline has faded, leaving the metal in a tight range below the key $4,570 level. Earlier this morning, Asian FX movements—driven by Iran’s Hormuz proposal—briefly supported risk appetite, but gold has failed to capitalise. The gold price now challenges a critical support zone that could determine the next directional move in the coming hours.
With the London session adding liquidity, volatility is expected to pick up. The bears are in control on multiple timeframes, and any bounce should be treated with caution. The immediate focus is on the $4,666 pivot level—a break below would accelerate selling pressure toward the daily downside target.
Gold Market Overview
Macro Context
The US Dollar Index is holding steady near recent highs, capping any upside in gold. US Treasury yields remain elevated, with the 10-year yield above 4.8%, further weighing on the non-yielding gold price. The market is pricing in a higher-for-longer Fed stance, and expectations for a rate cut in June have been pushed back. Meanwhile, geopolitical risk from the Hormuz Strait situation is providing a floor, but not enough to trigger a sustained rally.
Session Outlook
During the European session, gold traders should expect increased intraday volatility around the $4,570 level. The ATR(14) of $24.75 suggests a daily range of roughly $24 to $25. With the price already near the lower end of that band, a break of support could extend the range. Key triggers include any headlines on Iran negotiations or a sudden shift in DXY momentum. The overall bias remains bearish unless gold reclaims the $4,660 area.
Technical Analysis
Moving Average Structure
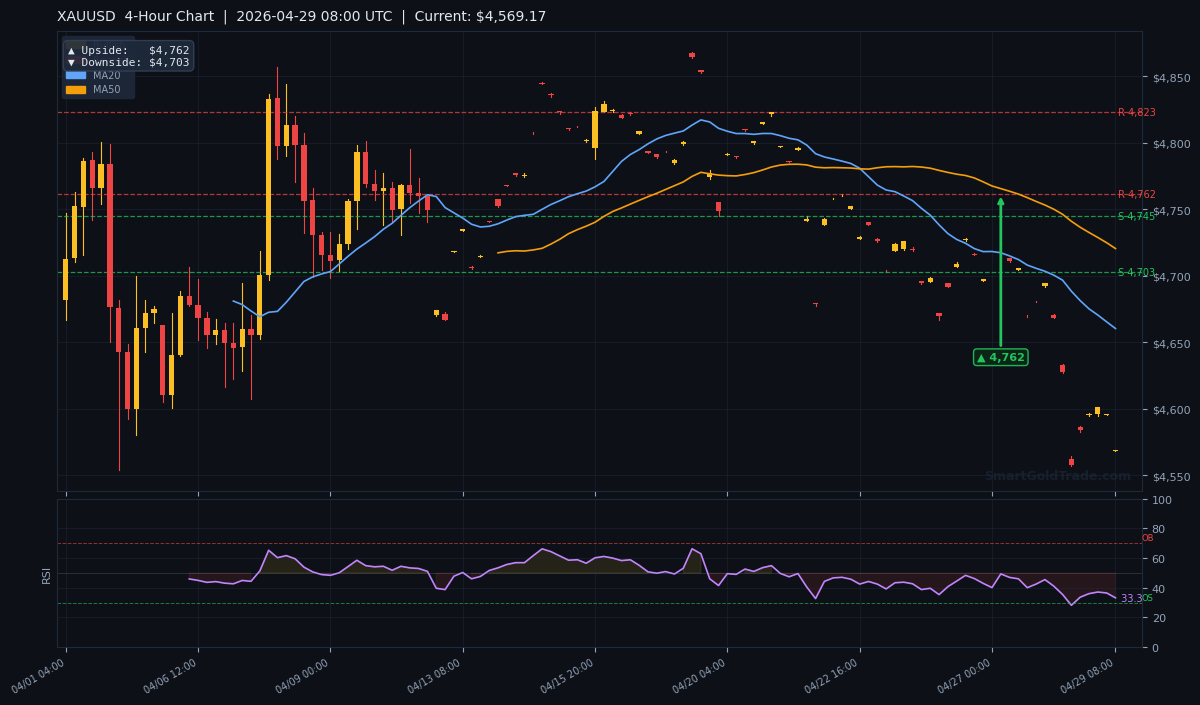
The MA20 is at $4,660.41, the MA50 at $4,720.52, and the MA200 at $4,701.74. The gold price is currently trading below all three moving averages, confirming a bearish structure on the 4-hour chart. The EMA structure shows MA20 below MA50, which is a short-term bearish pressure signal. Any recovery will first need to overcome the MA20 as immediate resistance.
RSI and Momentum
The RSI(14) sits at 33.3, which is in neutral territory but leaning toward oversold. This suggests that while selling momentum is strong, the market is not yet exhausted. Traders should watch for a potential bounce if the RSI approaches the 30 oversold threshold. However, without a clear catalyst, the risk remains tilted to the downside.
Key Price Levels
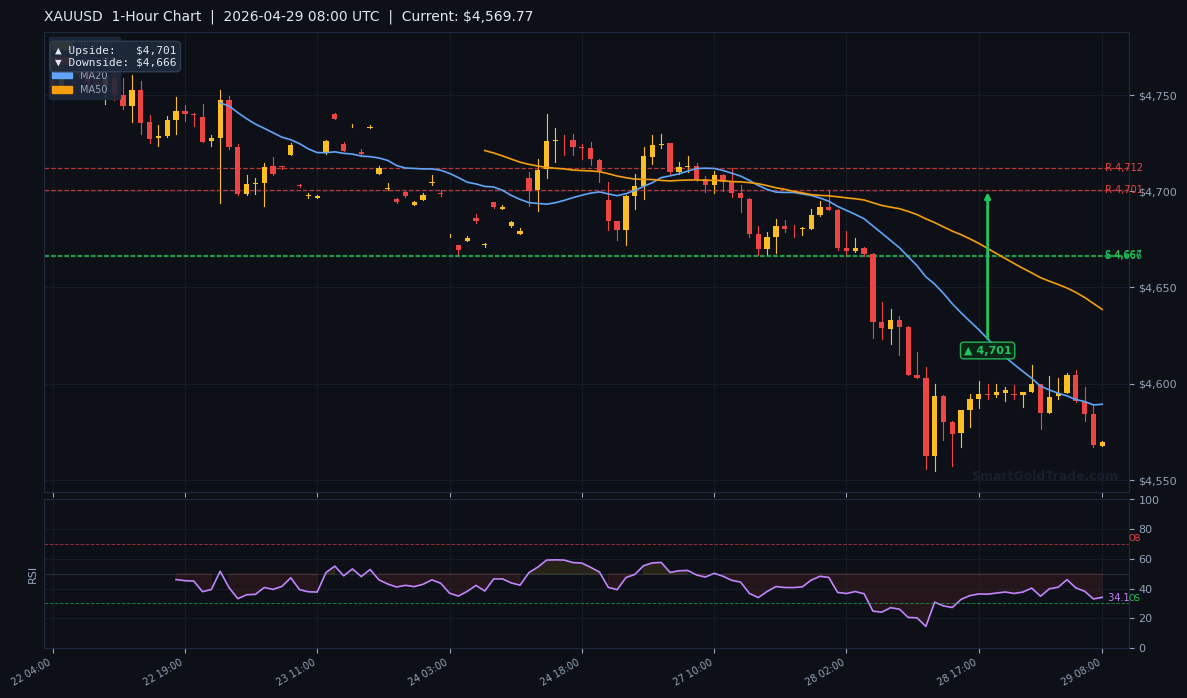
Based on the live indicator data, the support levels are S1: $4,784.22 and S2: $4,745.01. These levels are above the current price, meaning they will act as resistance zones if gold stages a recovery. The resistance levels are R1: $4,868.16 and R2: $4,823.31. Additionally, pivot arrows from the 1-hour chart point to an upside target of $4,701 and a downside target of $4,666. The 4-hour pivot targets are $4,762 upside and $4,703 downside. The daily pivot extremes are $5,045 upside and $4,967 downside.
The ATR(14) of $24.75 gives an expected daily range. With the current price at $4,569.17, a move to either side of this range is possible.
Fundamental Drivers
Macro and Geopolitical Factors
OCBC strategists Sim Moh Siong and Christopher Wong noted that most Asian FX firmed during the Asian session, led by MYR, THB, and TWD, helped by Iran’s proposal on the Hormuz Strait. This risk-on tilt briefly reduced safe-haven demand for gold. However, elevated oil prices and constrained energy pass-through pose risks to demand and could restrain high-beta, oil-sensitive Asian FX. For gold, the net effect remains mixed but leans bearish as the US Dollar stays bid.
Key Event to Watch
The most important event this week is the US ISM Manufacturing PMI, scheduled for release on May 1. A strong reading would reinforce the hawkish Fed narrative and further pressure the gold price. Conversely, a miss could trigger a short-term bounce. Traders should position accordingly, with stop losses wide enough to absorb potential volatility.
Devil's Advocate
Could the bears be wrong? Yes, if gold manages to reclaim the MA20 at $4,660.41 and hold above it through the European session. A break above that level would shift the bias back to neutral, with the MA200 at $4,701.74 as the next resistance. The 1-hour pivot upside target of $4,701 aligns well with that level. However, given the current structure, such a recovery would require a significant catalyst—perhaps a surprise dovish comment from the Fed or a sudden geopolitical escalation.
Trading Strategy for European Session
The prevailing bias is bearish. A sell entry near the current price of $4,569.17 is favourable, with a stop loss above the nearest pivot resistance. Using the ATR(14) of $24.75, a stop loss of $30 above the entry is reasonable—placing it at $4,599.17. Alternatively, a wider stop at the 1-hour downside pivot of $4,666 could be used for short-term targets. The take-profit target is the 1-hour downside level of $4,666, offering a risk-reward ratio of approximately 1:3. For those who prefer more conservative targets, the 4-hour downside of $4,703 is also a valid profit zone. Use the 1-hour pivot target as the primary target for intraday moves.
If gold bounces above $4,570 and holds, the setup is invalid. Traders should wait for a retest of $4,660 to consider short trades with a tighter stop.
Key Takeaways
- Gold price is at $4,569.17, below all key moving averages (MA20: $4,660, MA50: $4,720, MA200: $4,701).
- RSI at 33.3 is neutral but leaning bearish; a drop below 30 could trigger a short-term bounce.
- Immediate resistance is $4,660 (MA20); support at $4,666 (1-hour pivot).
- ATR of $24.75 suggests a daily range of roughly $4,545 to $4,594.
- Bearish bias persists unless gold reclaims $4,660.
- Key event: US ISM Manufacturing PMI on May 1 remains a major risk catalyst.
Conclusion
Gold price remains under pressure as the European session progresses. The technical structure is clearly bearish, with the metal trading below all major moving averages and momentum fading. The $4,666 level is the critical support to watch—a break could open the door toward the $4,570–$4,500 zone. Conversely, a recovery above $4,660 would signal a potential shift in sentiment. For now, the path of least resistance is lower, and traders should focus on short-side opportunities with disciplined risk management.
For those looking for professional guidance, professional gold trading signals provide real-time entry and exit alerts based on institutional-level analysis.
Frequently Asked Questions
- What is the current support level for gold?
- The 1-hour pivot indicates immediate support at $4,666. A break below that could lead to further selling toward $4,570 or lower.
- Where is the next resistance for gold?
- First resistance is the MA20 at $4,660.41. Above that, the MA200 at $4,701.74 and the 1-hour pivot at $4,701 are key levels.
- Is the RSI indicating oversold conditions?
- The RSI is at 33.3, which is neutral. It is not yet oversold (below 30), but it is getting close. Traders should watch for a potential bounce if the RSI dips further.
- What is the expected daily range based on ATR?
- With an ATR of $24.75, the daily range is approximately $24–$25. The current price near $4,569 suggests a possible move toward $4,545 on the downside or $4,594 on the upside.
Trading Gold (XAU/USD) carries significant risk of loss and is not suitable for all investors. This content is for informational purposes only and does not constitute financial advice. Always conduct your own research and trade responsibly.