
Gold price held steady above $4,600 in early Asian trading on Friday, supported by stronger-than-expected Chinese manufacturing data. The gold price currently trades at $4,625.20, consolidating within a narrow range as traders assess the next directional catalyst. While the short-term trend remains neutral, the focus is on whether bulls can push through the $4,646 resistance level. This session is likely to see low liquidity as markets digest the week's events, making patience essential for disciplined traders.
Gold Market Overview
Macro Context
The U.S. Dollar Index (DXY) softened slightly during the Asian session, providing a modest tailwind for gold. U.S. Treasury yields remain elevated near recent highs, capping aggressive bullish moves. Federal Reserve positioning is still data-dependent, with markets pricing in a potential rate cut later in the year. Geopolitical risks continue to simmer, offering underlying support for safe-haven demand.
Session Outlook
The Asian session typically sees thinner liquidity, which can lead to exaggerated moves. Today, the gold price is likely to remain range-bound between $4,605 and $4,646 until fresh news emerges. The absence of major U.S. data releases this morning means price action will be technically driven. Traders should avoid chasing breakouts and focus on well-defined levels.
Technical Analysis
Moving Average Structure
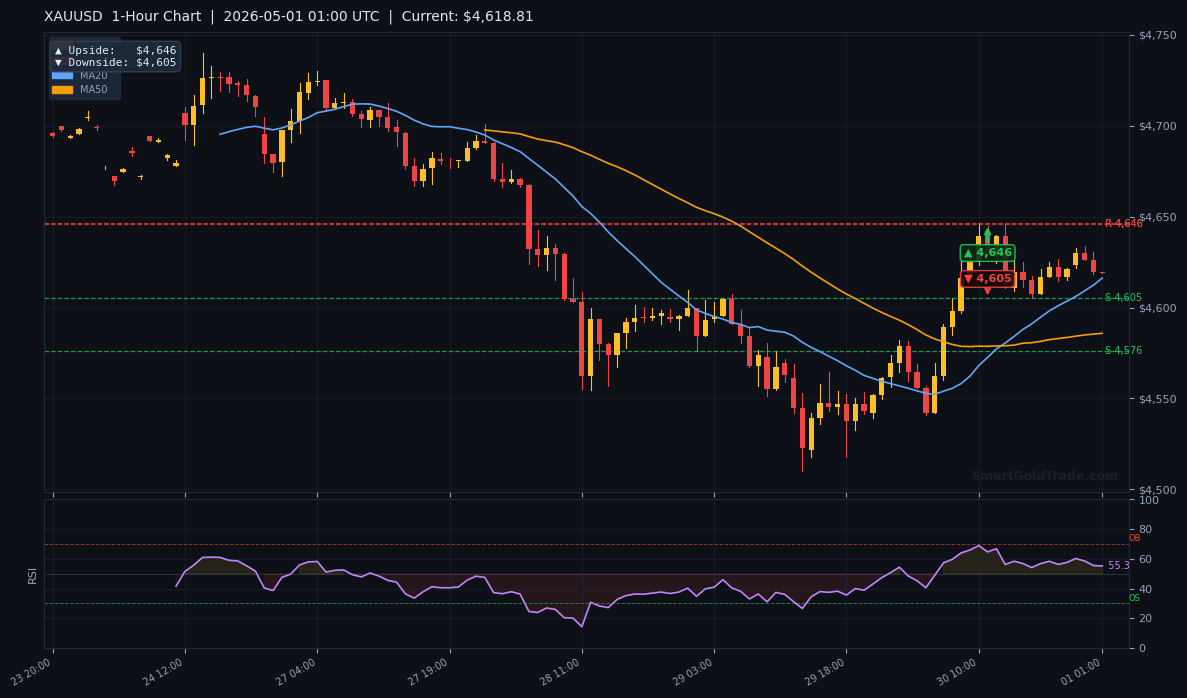
The MA20 is at $4,602.09, and price is above it, confirming short-term bullish momentum. However, the MA50 at $4,676.82 and the MA200 at $4,680.13 remain above the current price, indicating a bearish medium-to-long-term structure. The EMA structure also shows MA20 below MA50, signaling persistent downside pressure on higher timeframes.
RSI and Momentum
The 14-period RSI is at 49.8, squarely in neutral territory. This suggests that neither bulls nor bears have a strong grip on momentum. A move above 50 would tilt the bias toward buying, while a drop below 45 could reintroduce selling pressure.
Key Price Levels
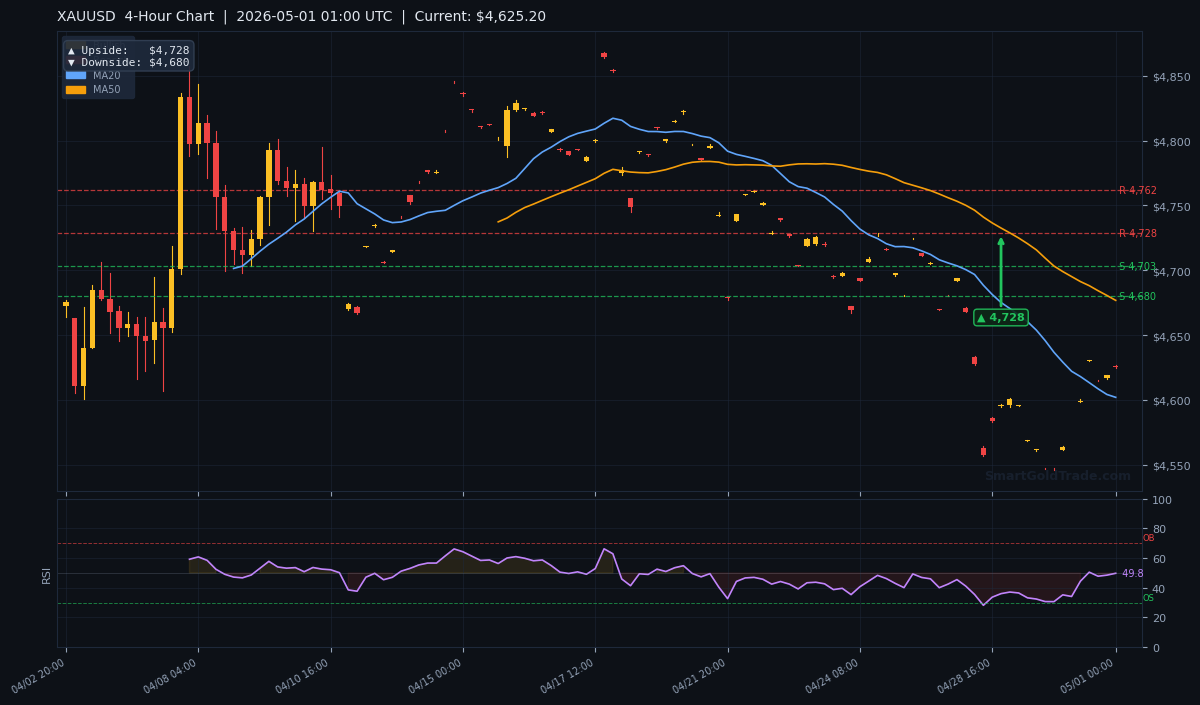
Based on the latest H4 chart, the key support levels are S1: $4,745.01 and S2: $4,703.05. Although price is currently trading below these levels, they may act as resistance if reclaimed to the upside. On the resistance side, R1: $4,823.31 and R2: $4,761.77 mark potential upside targets. The ATR(14) of $14.92 implies an expected intraday range of roughly $30, supporting a range-bound strategy.
From the pivot arrows on the charts, the daily upside target is $5,045 and downside $4,967. The 4-hour chart targets upside $4,728 and downside $4,680. The 1-hour chart targets upside $4,646 and downside $4,605.
Fundamental Drivers
China's manufacturing sector expanded more than expected in April, with the RatingDog Manufacturing PMI climbing to 52.2 from 50.8. This marks the strongest reading in months and points to sustained economic recovery in the world's largest gold consumer. A stronger Chinese economy supports gold demand both for industrial uses and investment, providing a fundamental floor under the gold price.
Key Event to Watch
The next significant event is the U.S. ISM Manufacturing PMI release, scheduled for later this week. If the data shows a similar expansion, it could strengthen the dollar and weigh on gold. Conversely, a weak print would reinforce rate-cut expectations and push gold higher.
Devil's Advocate
The main bullish scenario relies on gold price staying above $4,605 (1-hour downside pivot). A break below this level would invalidate the short-term bullish setup and open the path toward $4,576 and eventually $4,500. Additionally, a sudden spike in the dollar on strong U.S. data could trigger a quick sell-off. Traders must watch the $4,600 round number closely.
Trading Strategy for Asian Session
Entry Zone: Look to buy on dips between $4,615 and $4,620. This offers a favorable risk-reward ratio with support from the 1-hour pivot and the MA20 nearby.
Stop Loss: Place stops at $4,600, approximately $20 below entry, which is just above the ATR's expected range.
Take Profit: Target $4,646 (1-hour upside pivot) for a 1:2 risk-reward. A secondary target at $4,680 (4-hour downside pivot) could be considered if momentum builds.
For those seeking ethical trading, consider our halal gold trading platform which avoids interest and leverage, offering physical ownership. Alternatively, traders looking for real-time signals can access professional gold trading signals for precise entries.
Key Takeaways
- Gold price holds above $4,600 at $4,625.20, with neutral RSI at 49.8.
- China Manufacturing PMI surged to 52.2, supporting gold demand.
- Short-term resistance at $4,646 (1H pivot); support at $4,605 (1H pivot).
- MA20 ($4,602.09) confirms near-term bullish bias; MA50 ($4,676.82) remains overhead.
- ATR($14.92) suggests a range-bound session — avoid chasing breakouts.
- Trading strategy: buy dips near $4,615 with stop at $4,600, target $4,646.
Conclusion
Gold price is consolidating in a tight range after positive Chinese manufacturing data, with technicals pointing to a potential push toward $4,646. The neutral RSI and mixed moving averages warn against aggressive bets early in the session. Patience remains key — wait for a dip into support or a confirmed break above resistance before committing capital. The focus now shifts to U.S. ISM data later this week, which could determine the next major move.
Frequently Asked Questions
- What is the current gold price?
- The gold price is trading at $4,625.20 as of the Asian open on May 1, 2026.
- Why is gold price holding above $4,600?
- Support comes from stronger-than-expected China Manufacturing PMI (52.2) and technical buying near the MA20 at $4,602.09.
- Where is the first resistance for gold price today?
- The first resistance is at $4,646 (1-hour upside pivot), followed by $4,680 (4-hour downside pivot).
- What would invalidate the bullish outlook?
- A break below $4,605 (1-hour downside pivot) would turn the short-term trend bearish, potentially targeting $4,576 or lower.
- Is gold price overbought or oversold?
- The RSI(14) at 49.8 is neutral, indicating neither overbought nor oversold conditions.
Trading Gold (XAU/USD) carries significant risk of loss and is not suitable for all investors. This content is for informational purposes only and does not constitute financial advice. Always conduct your own research and trade responsibly.