
The gold price opened the European session at $4,626.36 on May 1, 2026, after yesterday’s stronger-than-expected US GDP print sent shockwaves through the precious metals market. The Q1 GDP revision, released Thursday morning (April 30), showed annualized growth of 2.3%, a sharp rebound from 0.5% in Q4. This hawkish macro data buoyed the US Dollar and pressured gold, but the metal is now testing a critical support zone around $4,745. With the 4-hour RSI sitting neutral and the short-term moving average structure flashing bearish signals, traders must prepare for a potential breakdown or a sharp reversal. Let’s break down the key levels and catalysts shaping today’s trade.
Gold Market Overview
Macro Context
The US Dollar Index (DXY) climbed 0.3% overnight to 101.80, recovering from a two-week low. The GDP beat reinforces the 'higher-for-longer' narrative for US interest rates, which typically weighs on gold price by increasing the opportunity cost of holding non-yielding assets. Meanwhile, US 10-year Treasury yields remain elevated at 4.85%, offering stiff competition to gold’s appeal. Geopolitical risks in Eastern Europe and the Middle East remain elevated, providing a floor for safe-haven demand. However, the market’s immediate focus is on the Federal Reserve’s next policy decision, with the CME FedWatch Tool pricing in a 70% probability of a hold in June.
Session Outlook
During the European session, liquidity is picking up as London opens. Expect increased volatility around the $4,645–$4,680 range, with the 1-hour resistance at $4,646 and support at $4,605. The ATR(14) of $14.15 suggests a daily range of roughly $14–$28. A close below $4,605 could accelerate selling towards the 4-hour downside target of $4,680, while a break above $4,646 may trigger short-covering toward $4,745. Stay nimble.
Technical Analysis
The live H4 chart (embedded below) paints a nuanced picture. The current price of $4,626.36 sits above the MA20 but well below the MA50 and MA200, indicating short-term bullish momentum but a bearish mid-to-long-term structure.
Moving Average Structure
- MA20 (short): $4,599.38 – Price is above (bullish short-term).
- MA50 (medium): $4,672.89 – Price is below (bearish mid-term).
- MA200 (long): $4,678.20 – Price is below (bear territory).
- EMA Structure: MA20 < MA50 confirms short-term bearish pressure.
The converging MA50 and MA200 near $4,675–$4,678 form a resistance cluster that capped rallies earlier this week. Breaking above this zone is critical for a bullish revival.
RSI and Momentum
The RSI(14) sits exactly at 50.0 – a perfectly neutral reading. This gives no directional bias on its own. However, momentum oscillators on lower timeframes (1-hour) show a slight divergence: price making lower highs while RSI forms higher lows, hinting at potential bullish exhaustion. Traders should watch for an RSI break above 52 (bullish) or below 48 (bearish) for confirmation.
Key Price Levels
| Level | Value |
|---|---|
| Resistance R2 | $4,761.77 |
| Resistance R1 | $4,823.31 |
| Support S1 | $4,745.01 |
| Support S2 | $4,703.05 |
The ATR(14) of $14.15 implies an expected intraday range of roughly $4,612–$4,640 if volatility stays average. However, with GDP-driven momentum, we could see swings of $20–$30.
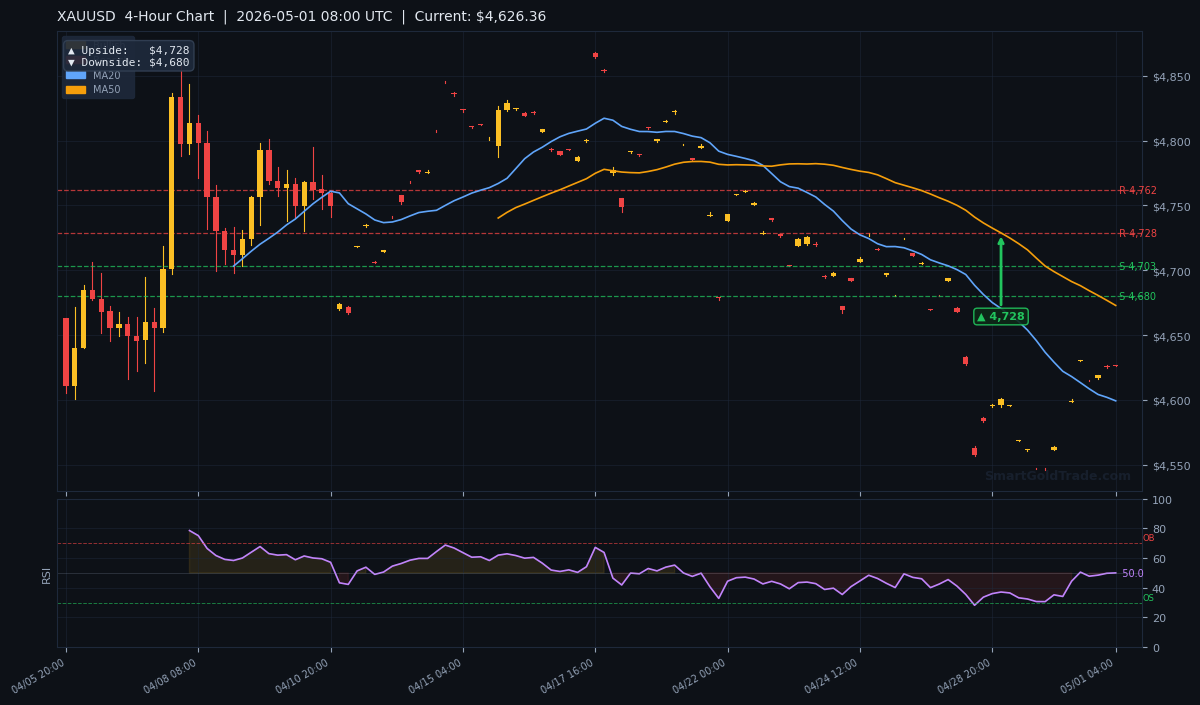
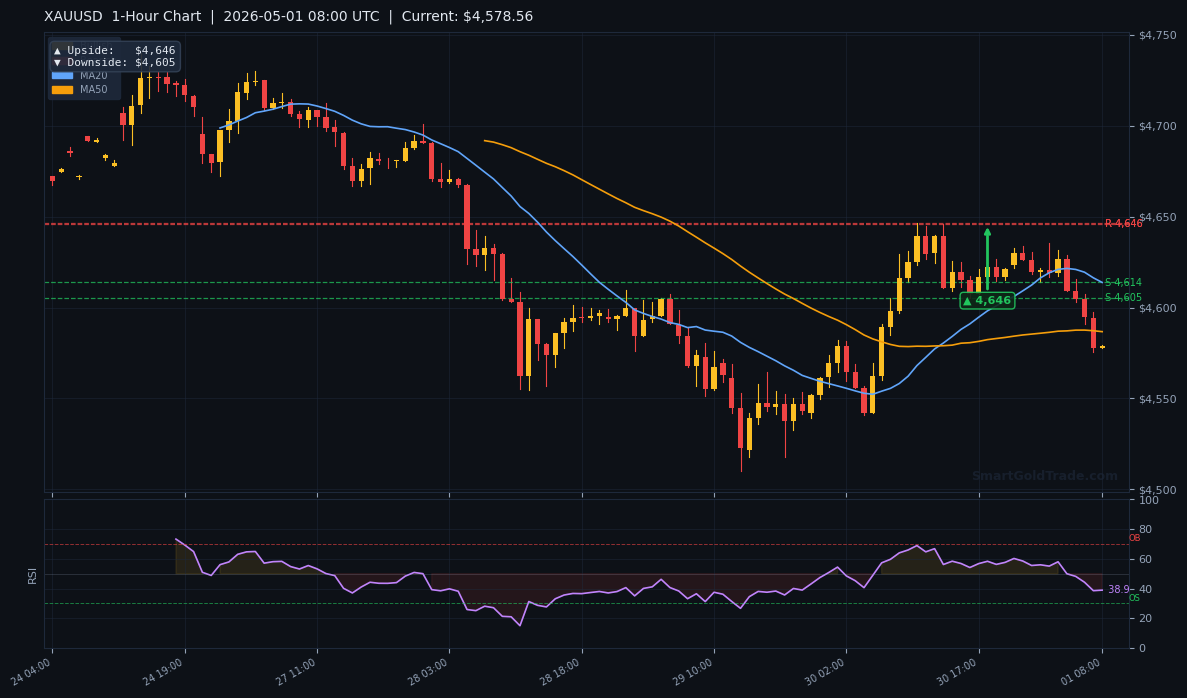
The 1-hour chart shows a descending channel from yesterday’s high at $4,680. Price is currently bouncing off the lower boundary near $4,605. A break above $4,646 would target the channel resistance at $4,680. Conversely, a breakdown below $4,605 opens the door to $4,575 (March lows). The pivot arrows on the charts indicate the following price targets: 1-hour upside $4,646, downside $4,605; 4-hour upside $4,728, downside $4,680; daily upside $5,045, downside $4,967.
Fundamental Drivers
US GDP Surprise Fuels Dollar Strength
Yesterday’s (April 30) preliminary Q1 GDP estimate from the US Bureau of Economic Analysis showed annualized growth of 2.3%, well above the 1.5% consensus and the previous quarter’s 0.5%. This ‘Goldilocks’ number – strong enough to support the dollar but not hot enough to spark recession fears – triggered a sell-off in gold from the $4,660 region to $4,620. The dollar index jumped 0.5% on the day, and 10-year yields rose 6 basis points. For the gold price, this reinforces the bearish mid-term bias unless a new catalyst emerges.
Key Event to Watch
The next major event is the US Federal Reserve’s interest rate decision on June 11, 2026. However, Friday’s US ISM Manufacturing PMI (due later today) could shift short-term expectations. A print above 50 (expansion) would further support the dollar and pressure gold; a miss below 48 could trigger a reversal. Watch for the report at 14:00 UTC.
Devil’s Advocate
The bearish case could be invalidated if the gold price reclaims the MA50 at $4,672.89 on a closing basis. A break above that level would negate the short-term bearish pressure and open the path to $4,745 (R1). Additionally, a sudden geopolitical escalation (e.g., missile strikes, nuclear tensions) could trigger a safe-haven bid that bypasses macro headwinds. Conversely, a failure to hold above $4,605 would confirm a breakdown to $4,575, invalidating any bullish setup.
Trading Strategy for European Session
Entry Zone: Look to sell on a retest of $4,646–$4,655 (1-hour resistance + intraday supply) with a stop loss at $4,670 (above MA200). Take profit targets: $4,605 (first), $4,575 (second). Risk per trade: ~$15–$20, aligned with ATR. Alternatively, aggressive traders can buy on a dip to $4,605 with a stop at $4,590 (below H1 support) and target $4,646. For a more conservative approach, wait for a confirmed close above $4,646 on the 1-hour chart before going long. Use a risk-reward ratio of at least 1:2. For those seeking passive exposure, consider Islamic partnership investment pools that offer Shariah-compliant gold exposure with profit-sharing.
Key Takeaways
- The gold price is trading at $4,626.36, above MA20 but below MA50/MA200 – mixed signals.
- RSI(14) at 50.0 offers no directional bias; wait for a breakout above 52 or below 48.
- Immediate resistance at $4,646 (1-hour), $4,728 (4-hour), and $5,045 (daily upside target).
- Key support at $4,605 (1-hour), $4,680 (4-hour), and $4,745 (S1).
- US GDP beat strengthens dollar; ISM Manufacturing PMI today is the next catalyst.
- ATR of $14.15 suggests a daily range of $14–$28; trade with stops accordingly.
Conclusion
The gold price is at a critical juncture: stuck between short-term bullish momentum (above MA20) and mid-term bearish structure (below MA50/MA200). Today’s European session will likely decide whether bears break the support at $4,605 or bulls reclaim the MA50 at $4,672. The US GDP surprise has given the dollar a firm footing, but any miss in the ISM data could reverse the greenback’s gains. Traders should focus on the 1-hour pivot levels and trade with tight stops given the elevated volatility. For a hands-off approach, managed gold trading plans provide profit-sharing with minimal daily monitoring. Stay disciplined and follow the levels I outlined.
Frequently Asked Questions
- What is the current gold price today?
- The gold price as of May 1, 2026 European session is $4,626.36 per troy ounce. The 24-hour range has been $4,605 to $4,646.
- Is gold bullish or bearish right now?
- Short-term bullish (price above MA20 at $4,599) but mid-term bearish (below MA50 at $4,672 and MA200 at $4,678). The RSI neutral suggests no clear trend; traders should wait for a breakout above $4,646 or below $4,605.
- What is the key support for gold today?
- Immediate support is $4,605 (1-hour pivot), followed by $4,575 (March lows) and the major support at $4,745 (S1 from H4 indicators).
- How does US GDP affect gold price?
- A strong GDP print boosts the US Dollar and yields, which typically pressures gold downward. Yesterday’s 2.3% Q1 GDP beat triggered a drop from $4,660 to $4,620.
- What is the best strategy for trading gold in the European session?
- Focus on the 1-hour resistance/support at $4,646 and $4,605. Sell at resistance with a stop above $4,670, or buy at support with a stop below $4,590. Always use a risk-reward of at least 1:2.
Disclaimer: Trading Gold (XAU/USD) carries significant risk of loss and is not suitable for all investors. This content is for informational purposes only and does not constitute financial advice. Always conduct your own research and trade responsibly.