
The gold price is under heavy selling pressure in early Asian trading on Tuesday, hovering near $4,520 as bearish technicals outweigh the safe-haven bid from ongoing Middle East tensions. Last week's US employment data for April offered little support, leaving the metal vulnerable to further downside in thin liquidity conditions. Traders must exercise caution — chasing moves in low volume often leads to whipsaws, and the current setup demands patience rather than aggression.
Gold Market Overview
Macro Context
The US Dollar Index (DXY) remains steady near 101.50, capping any upside for non-dollar assets. US Treasury yields are holding firm near 4.25%, reducing the opportunity cost of holding gold. The Federal Reserve’s recent dovish hold has been fully priced in, and markets now look to next week’s FOMC minutes for fresh guidance. Geopolitical risk from the Middle East continues to provide a floor, but it is not strong enough to reverse the current technical damage.
Session Outlook
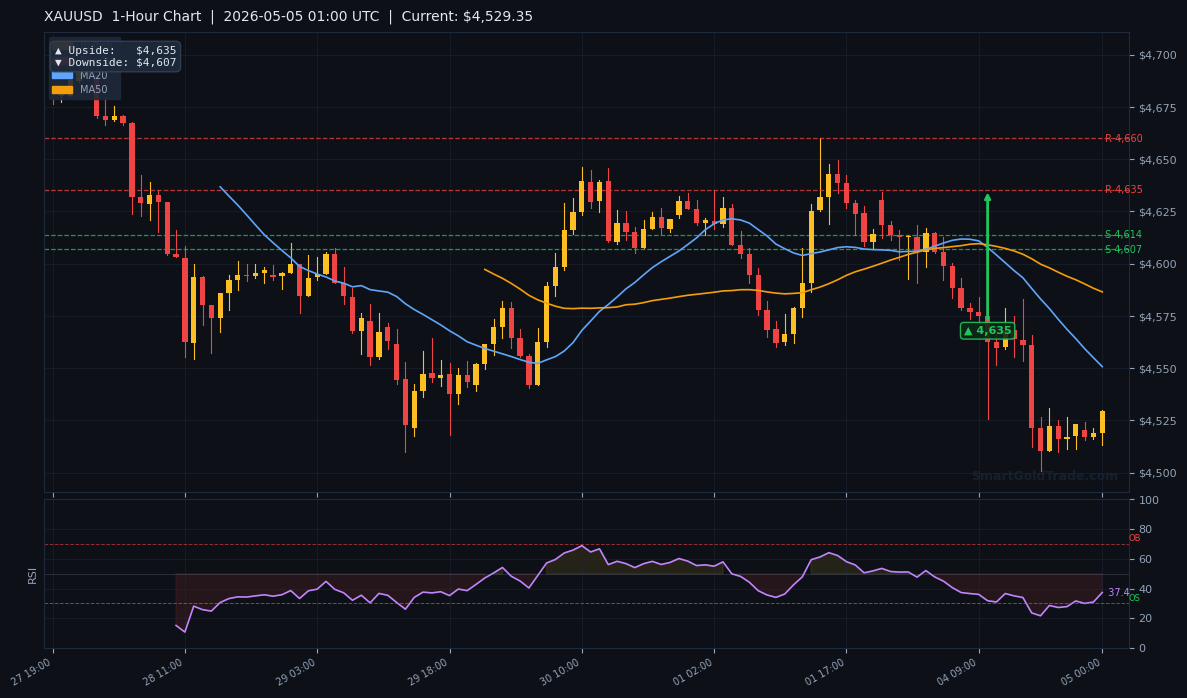
Asian session liquidity is typically thin, and Tuesday is no exception. Expect price action to remain muted between $4,510 and $4,535 during the first half of the session. A break below $4,510 could accelerate selling toward the 1-hour downside target of $4,607. Conversely, any bounce is likely to be capped by the MA20 zone near $4,588. The key trigger later this week will be the ISM Services PMI, which could inject fresh volatility.
Technical Analysis
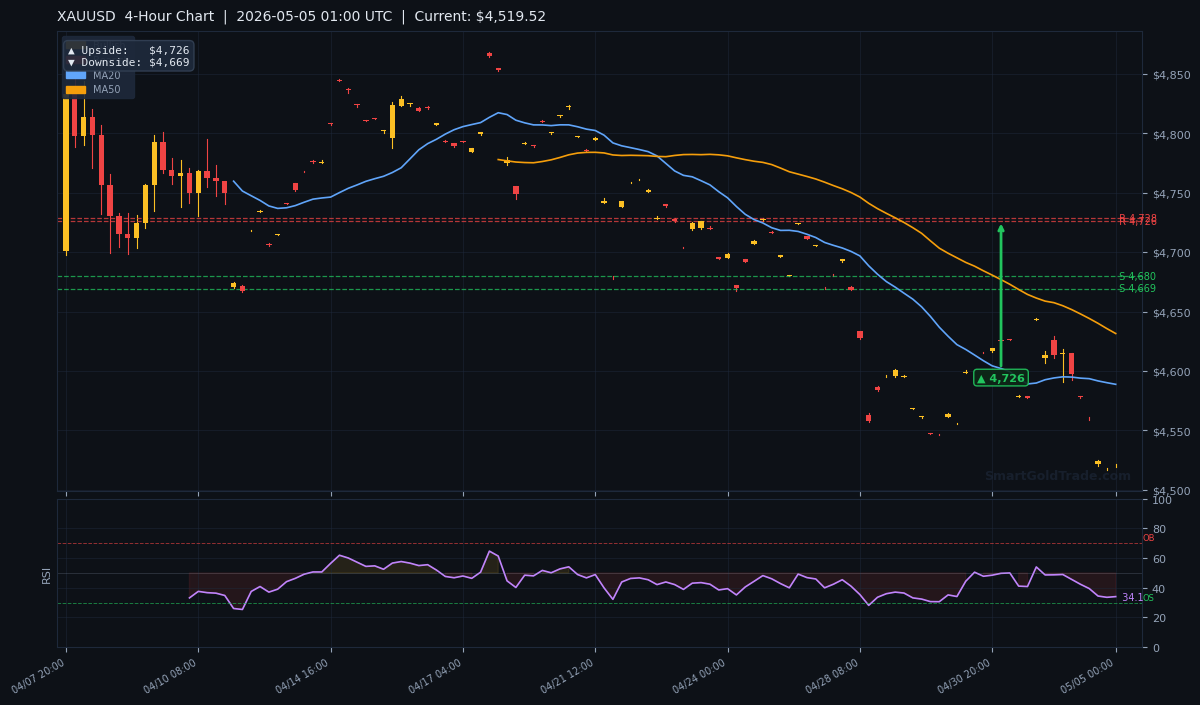
The charts paint a clear bearish picture. On the 4-hour timeframe, the MA20 at $4,588.79, MA50 at $4,631.51, and MA200 at $4,655.34 all lie above the current price, forming a classic bearish alignment. The EMA structure confirms short-term selling pressure as MA20 < MA50.
Moving Average Structure
Price below all three major moving averages signals a strong downtrend. The MA20 at $4,588.79 is the first overhead resistance; a reclaim of that level would be necessary to ease bearish momentum. The MA50 at $4,631.51 and MA200 at $4,655.34 represent deeper resistance zones. Until the gold price can close above $4,588, every rally is a selling opportunity.
RSI and Momentum
The RSI(14) stands at 34.1, which is technically neutral but leaning toward oversold territory. This suggests that while selling pressure is dominant, the market is not yet exhausted. There is room for further decline before a meaningful bounce. Traders should not interpret a sub-35 RSI as an automatic buy signal — in strong trends, RSI can remain in oversold conditions for extended periods.
Key Price Levels
Support S1: $4,703.05 (pivot level, currently above price — acts as resistance on rallies)
Support S2: $4,679.99
Resistance R1: $4,761.77
Resistance R2: $4,728.36
The ATR(14) of $23.11 indicates an expected daily range of about $23. Given the bearish bias, the downside targets from the 1-hour chart at $4,607 and the 4-hour chart at $4,669 are more immediate.
| Timeframe | Upside Target | Downside Target |
|---|---|---|
| Daily | $5,045 | $4,667 |
| 4-Hour | $4,726 | $4,669 |
| 1-Hour | $4,635 | $4,607 |
Fundamental Drivers
The Middle East situation remains unresolved, keeping a floor under the gold price, but it is not enough to reverse the technical trend. The US employment data for April (released last Friday) showed job growth of 185,000, slightly below estimates, which initially lifted gold above $4,600 before sellers took over. The market is now resetting expectations ahead of the ISM Services PMI due later this week.
Key Event to Watch
The ISM Services PMI for April will be released on Thursday. A print below 50 could revive recession fears and boost gold’s safe-haven appeal. Conversely, a strong reading above 55 would reinforce the ‘higher-for-longer’ rate narrative and put additional pressure on the metal. Traders should mark this date and reduce position sizes ahead of the release.
Devil's Advocate
The bearish thesis could be invalidated if the gold price reclaims the MA20 at $4,588.79 and holds above it for two consecutive 4-hour candles. Such a move would indicate the downtrend is losing momentum and open the door for a retest of $4,635 (1-hour upside target). A close above $4,635 would flip the short-term bias to bullish. Additionally, a sudden de-escalation in the Middle East or a sharp USD sell-off could spark a short-covering rally.
Trading Strategy for Asian Session
Given low liquidity and a clear bearish structure, the favored approach is to sell into strength. Look for a short entry near $4,525–$4,535, with a stop loss at $4,555 (above the Asian session highs). The first take-profit target is $4,607 (1-hour downside target), followed by $4,467 (daily downside target). Risk to reward is approximately 1:2. For traders who prefer to wait, a break below $4,510 with a 15-minute close would confirm selling momentum and provide a cleaner entry. Alternatively, a bounce to $4,580–$4,588 could be used for a short entry with a tighter stop above $4,600.
For those seeking real-time guidance, professional gold trading signals can provide precise entry and exit points tailored to current market conditions. Additionally, investors looking to own physical bullion as a long-term hedge can purchase physical gold from SmartGoldTrade’s certified collection.
Key Takeaways
- Gold price trades at $4,519.52, below all three major moving averages — strong bearish bias.
- MA20 at $4,588.79 is the first key resistance; a break above it is needed to ease downside pressure.
- RSI at 34.1 signals room for further decline before oversold conditions become extreme.
- Immediate downside target is $4,607 (1-hour pivot), with a deeper target at $4,467 on the daily chart.
- Thin Asian liquidity increases the risk of fakeouts — avoid chasing moves and wait for confirmed breaks.
- ISM Services PMI on Thursday is the week’s main fundamental catalyst.
Conclusion
The gold price is firmly in bearish territory, pressured by a falling technical structure and a steady dollar. While geopolitical risks provide intermittent support, the path of least resistance remains lower. Traders should focus on short strategies toward $4,607, with a defensive stop above $4,555. Watch the ISM Services PMI on Thursday for the next directional impulse. Stay patient, respect the levels, and let the market confirm the move before committing capital.
Frequently Asked Questions
- What is the current gold price?
- The live gold price is $4,519.52 per troy ounce as of 01:00 UTC on May 5, 2026.
- Where can I buy physical gold?
- You can buy certified gold coins and bars from SmartGoldTrade’s online store, offering 22K coins and 24K bars with guaranteed purity.
- What is the bearish target for gold this week?
- The 1-hour downside target is $4,607. If that breaks, the 4-hour target at $4,669 and the daily target at $4,467 come into play.
- What could reverse the current downtrend?
- A sustained break above the MA20 at $4,588.79, followed by a close above $4,635, would shift the bias back to bullish.
- Is it safe to trade gold during the Asian session?
- Yes, but liquidity is lower, so spreads may widen and price moves can be exaggerated. Use smaller position sizes and tighter stops.
Trading Gold (XAU/USD) carries significant risk of loss and is not suitable for all investors. This content is for informational purposes only and does not constitute financial advice. Always conduct your own research and trade responsibly.