
The gold price is holding above the $4,645 support zone as European session liquidity returns, with bulls locking in on the $4,725 resistance level. This morning's Spanish Letras auction saw yields edge higher to 2.635%, reflecting cautious eurozone sentiment but failing to derail gold's intraday recovery. With the 4-hour chart showing price above both the MA20 and MA50, short-term momentum favors the upside.
Traders are now watching whether the gold price can sustain above the psychologically important $4,650 level and challenge the $4,725 barrier later in the session.
Gold Price Market Overview
Macro Context
The US Dollar Index (DXY) remains under mild pressure near 101.80, providing a tailwind for gold as an alternative asset. US Treasury yields are pulling back from recent highs, with the 10-year note trading at 4.21%, down 3 basis points overnight. This softening in nominal yields supports the non-yielding metal.
Meanwhile, the Federal Reserve remains in a wait-and-see mode, with market-implied probabilities for a June rate cut barely shifting above 30%. Geopolitical uncertainty continues to simmer beneath the surface, but no fresh catalyst has emerged this week to drive safe-haven flows. The broader macro environment remains data-dependent, with traders eyeing any surprise from US economic releases later this week.
Session Outlook
The European session typically brings higher liquidity and sharper moves as London desks open. Today, the focus is on whether the gold price can reclaim the $4,670 handle and test the $4,703 overhead resistance. A break above $4,703 could accelerate buying toward the $4,725 pivot. On the downside, a loss of $4,620 would shift the bias back to neutral.
Technical Analysis
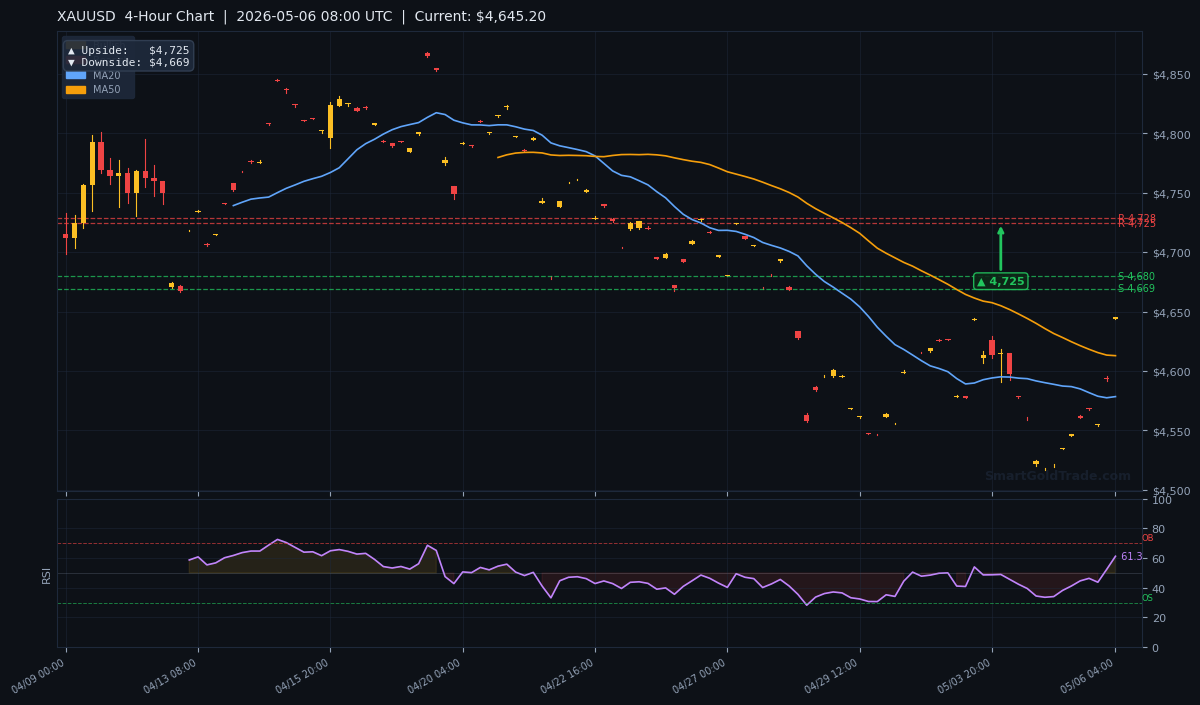
The 4-hour chart shows the gold price trading at $4,645.20, with clear short-term bullish signals but long-term caution.
Moving Average Structure
The MA20 (short-term) sits at $4,578.46, and the gold price is comfortably above it, indicating bullish near-term momentum. The MA50 (medium-term) at $4,612.88 is also below the gold price, confirming the mid-term positive trend. However, the MA200 (long-term) at $4,651.15 remains a resistance level — the gold price is currently below it, keeping the broader bias in bear territory.
The EMA structure shows MA20 below MA50, which typically signals short-term bearish pressure, so the current rise is a counter-trend move that needs to clear the MA200 to gain full conviction.
RSI and Momentum
The RSI(14) reads 61.3, firmly in neutral territory — neither overbought nor oversold. This leaves room for further upside in the gold price without immediate exhaustion. The ATR(14) of $21.56 suggests an average daily range of roughly $22, so moves of $15–$25 in either direction are within normal volatility.
Key Price Levels
The indicator data lists support at $4,703.05 (S1) and $4,679.99 (S2), but note these are above the current gold price — they actually serve as overhead resistance clusters. True support lies at the MA20 ($4,578.46) and MA50 ($4,612.88). Resistance is defined at $4,728.36 (R1) and $4,726.40 (R2) — a tight zone that could act as a barrier.
The 1-hour chart target is upside $4,586 (already broken) and downside $4,546, while the daily chart points to $4,857 upside and $4,667 downside.
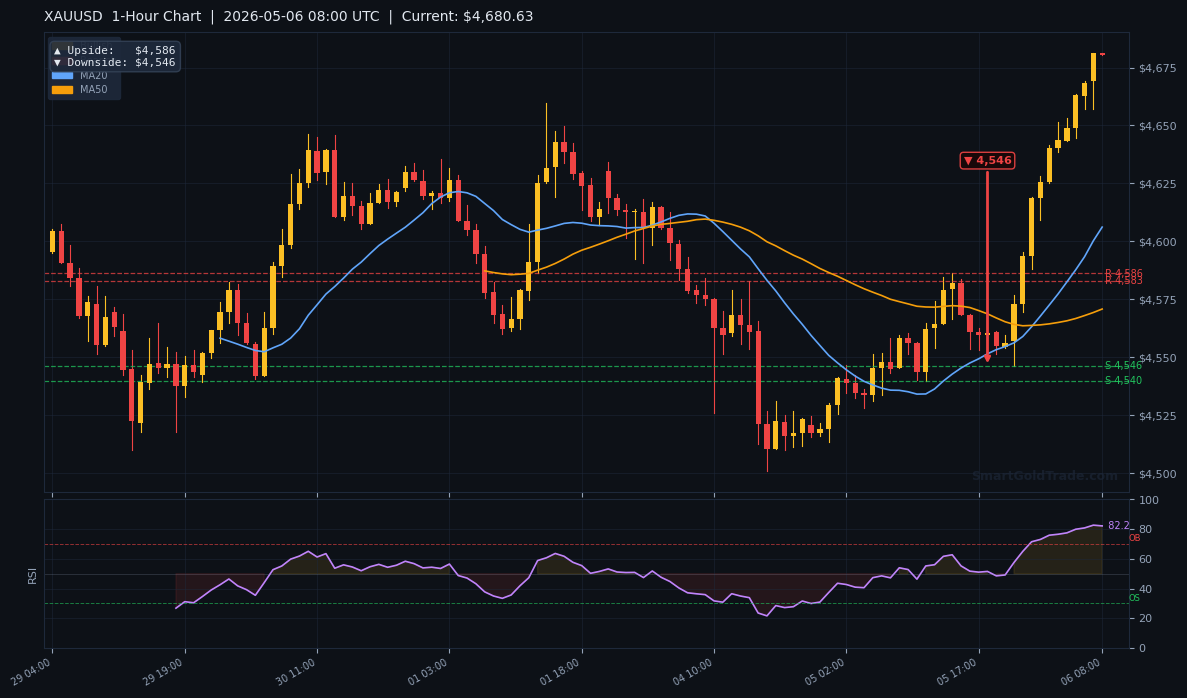
| Timeframe | Upside Target | Downside Target |
|---|---|---|
| 1-Hour | $4,586 | $4,546 |
| 4-Hour | $4,725 | $4,669 |
| Daily | $4,857 | $4,667 |
Fundamental Drivers
The only notable event from the source material is the Spanish 12-Month Letras Auction, which saw its yield increase to 2.635% from the previous 2.611%. While this is a minor move, it reflects a slight tightening in eurozone money markets, which could weigh on the euro and indirectly support the US dollar. However, the impact on the gold price has been negligible so far.
The broader fundamental picture remains unchanged: the Fed's cautious stance, sticky inflation, and geopolitical uncertainties keep the gold price supported but range-bound. The US dollar's mild weakness today is the primary driver of the current bounce.
Key Event to Watch
Later this week, traders will monitor speeches from Fed officials for any hawkish or dovish surprises. A dovish lean could trigger a rally above $4,728, while hawkish comments might reverse the move back toward $4,612. No major US data is due today, so technicals and intermarket flows will dictate the gold price action.
Devil's Advocate
The main bullish bias could be invalidated if the gold price fails to hold above the MA50 at $4,612.88. A break below that level would expose the MA20 at $4,578.46 and completely negate the short-term uptrend. Additionally, if the DXY reverses higher and reclaims 102.00, the gold price could suffer a sharp intraday selloff. The key reversal level to watch is $4,620; a daily close below it would shift the bias from bullish to neutral.
Trading Strategy for European Session
Given the current setup, a cautious bullish approach is warranted.
Enter long near $4,640–$4,650 (current zone) with a stop loss at $4,615 (below the $4,620 reversal level, respecting 1x ATR).
The first take-profit target is $4,703 (S1 resistance), and the second is $4,725 (R1). The risk-reward on the first target is roughly 1:3.
For those using Shariah-compliant methods, halal gold trading on a spot basis avoids leverage and interest.
Alternatively, traders seeking precise entries can follow professional gold trading signals for real-time updates.
How Gold Price Affects Shariah-Compliant Investing
For Muslim investors, the gold price isn't just a number — it's a gateway to wealth preservation that aligns with Islamic principles. Because riba (interest) is prohibited, conventional leverage-based gold products are off the table. Instead, Shariah-compliant platforms let you own physical gold outright or trade on a spot basis, so every pip of movement in the gold price reflects real, tangible value.
When the gold price dips, long-term holders often see it as a buying opportunity for physical assets. You can purchase physical gold — 24K bars, 22K coins, or even halal gold jewelry — directly through a fully allocated model. That way, you're not just speculating on the gold price; you're securing an asset you can hold, gift, or convert whenever you choose.
Even if you prefer a managed approach, the gold price still drives your profit share. Islamic partnership investments (musharakah) pool funds into Shariah-audited gold strategies, distributing returns quarterly. So whether you're a hands-on trader or a passive investor, the gold price is the thread that ties your portfolio to real value without compromising your faith.
Factors That Influence the Gold Price in 2026
Knowing what moves the gold price helps you anticipate shifts before they happen. In 2026, three forces stand out. First, US monetary policy: the Federal Reserve's rate path directly impacts the dollar and real yields, both of which share a strong inverse relationship with the gold price. Even a subtle change in rate-cut expectations can cause repricing of tens of dollars per ounce within a single session.
Second, geopolitical friction remains an ever-present catalyst. While the gold price doesn't react to every headline, sudden escalations in trade wars or regional conflicts still trigger immediate safe-haven bids. Third, central bank buying patterns — especially from emerging markets — set a floor under the gold price, absorbing supply that might otherwise weigh on the market.
Inflation expectations play a quieter but equally important role. Sticky consumer prices keep the gold price buoyant because physical gold retains purchasing power when fiat currencies erode. Traders often monitor breakeven inflation rates and commodity indexes for clues, making the gold price a mirror of real money health.
Key Takeaways
- Gold price holds above $4,645 support, with short-term MA20 and MA50 bullish.
- RSI at 61.3 leaves room for further upside without overbought pressure.
- Immediate resistance zone: $4,703–$4,728; a break above could target $4,857.
- Key support levels to watch: MA20 at $4,578 and MA50 at $4,613.
- ATR of $21.56 suggests a typical intraday range of $20–$22.
- European session bias: bullish above $4,620, bearish below.
Conclusion
The gold price is displaying a constructive short-term setup as European trading begins. With price above the MA20 and MA50, and the RSI neutral, bulls have a clear path toward the $4,703–$4,725 resistance band. However, the lingering MA200 overhead at $4,651 acts as a magnet and must be reclaimed for the rally to extend.
Traders should watch the $4,620 level as a line in the sand — above it, dips are buying opportunities. Below it, caution prevails. For today, the bias remains bullish with a focus on the $4,725 target.
FAQ
Is the current gold price holding above key support?
Yes, the gold price is hovering near $4,645, which sits above the MA20 at $4,578 and the MA50 at $4,613. The MA200 at $4,651 is immediate resistance, so a sustained move above that would cement support near current levels.
What resistance levels should gold price traders watch?
The next resistance cluster is $4,703 (S1), followed by $4,725 (R1 and the 4-hour upside target). A break above $4,725 could open the door to the daily upside target of $4,857.
How can I trade the gold price move during the European session?
A conservative approach is to look for entries near $4,640–$4,650 with a stop at $4,615, targeting $4,703 and $4,725. Using a Shariah-compliant spot account ensures your gold price exposure stays free from interest and leverage.
Trading Gold (XAU/USD) carries significant risk of loss and is not suitable for all investors. This content is for informational purposes only and does not constitute financial advice. Always conduct your own research and trade responsibly.