
The gold price is holding above the $4,680 support zone after stronger-than-expected US economic data released earlier today. Despite a neutral US Dollar Index near 98.50 and elevated Treasury yields, XAUUSD has shown resilience, trading at $4,693.16 as of 20:00 UTC. This session, the battle between short-term bearish pressure and a long-term bullish trend is coming to a head.
Gold Market Overview
Macro Context
The US Dollar Index (DXY) remains neutral near 98.50, supported by safe-haven demand and elevated yields. Upbeat US data earlier in the session gave the dollar a brief lift, but gold absorbed the pressure. Middle East headlines continue to add intermittent volatility, keeping a floor under the gold price. The Fed is still in a wait-and-see mode, with no major speeches scheduled today.
Session Outlook
During the American session, liquidity is high, and the expected daily range based on the ATR of $20.59 suggests a move between roughly $4,673 and $4,714. The key trigger remains any fresh geopolitical headline or a shift in US bond yields. If yields rise further, gold could test the $4,667 daily downside pivot.
Technical Analysis
Let's examine the live technical indicators from the H4 chart data provided by SmartGoldTrade's proprietary system.
Moving Average Structure
The current gold price of $4,693.16 sits well above the MA20 at $4,592.06, the MA50 at $4,611.41, and the MA200 at $4,651.77. This confirms a long-term bull market. However, the EMA structure shows MA20 < MA50, indicating short-term bearish pressure. This divergence between the upward-sloping MA200 and the slightly crossed short-term MAs explains the choppy, range-bound action seen today.
RSI and Momentum
The RSI(14) reads 65.7, which is firmly in neutral territory — neither overbought nor oversold. This leaves room for a push higher without immediate reversal risk. Momentum is balanced, confirming that buyers and sellers are evenly matched near current levels.
Key Price Levels
Based on the chart data, the support and resistance levels are clear. Support S1 sits at $4,679.99, with S2 deeper at $4,669.34. On the upside, resistance R1 is at $4,728.36 and R2 at $4,726.40. Note that R2 is marginally below R1, suggesting a dense resistance zone near $4,726-$4,728. The ATR of $20.59 suggests a likely intraday range of roughly $4,673 to $4,714 around the current price.
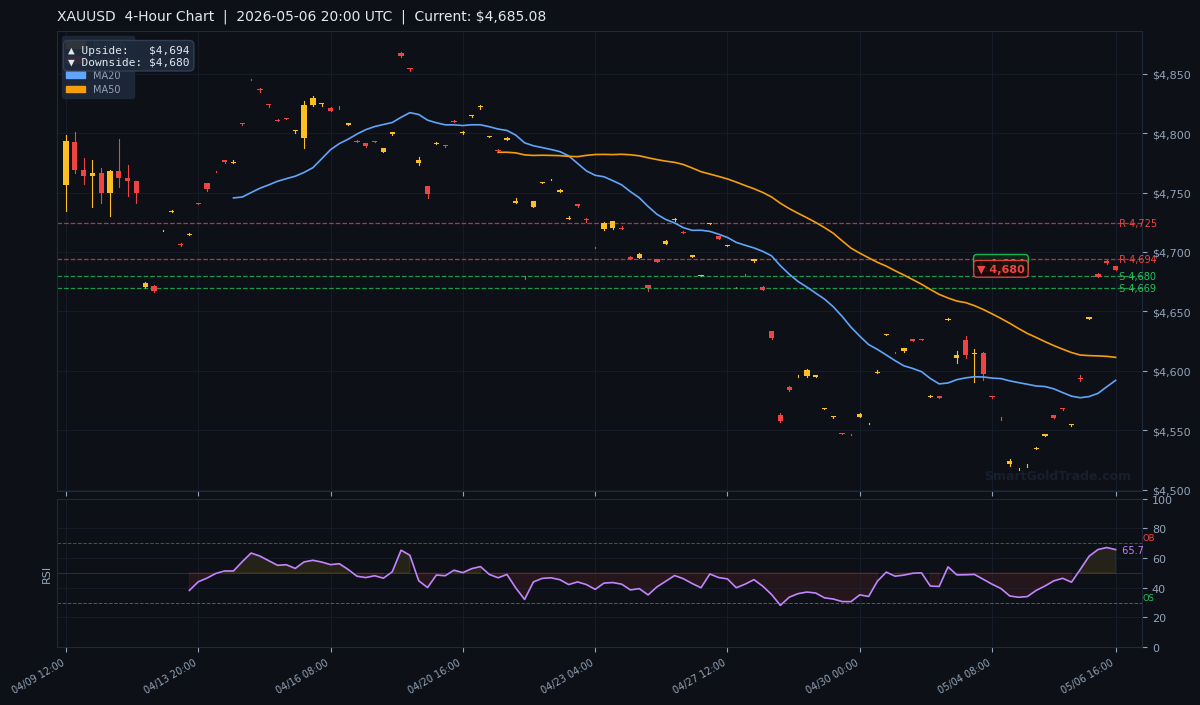
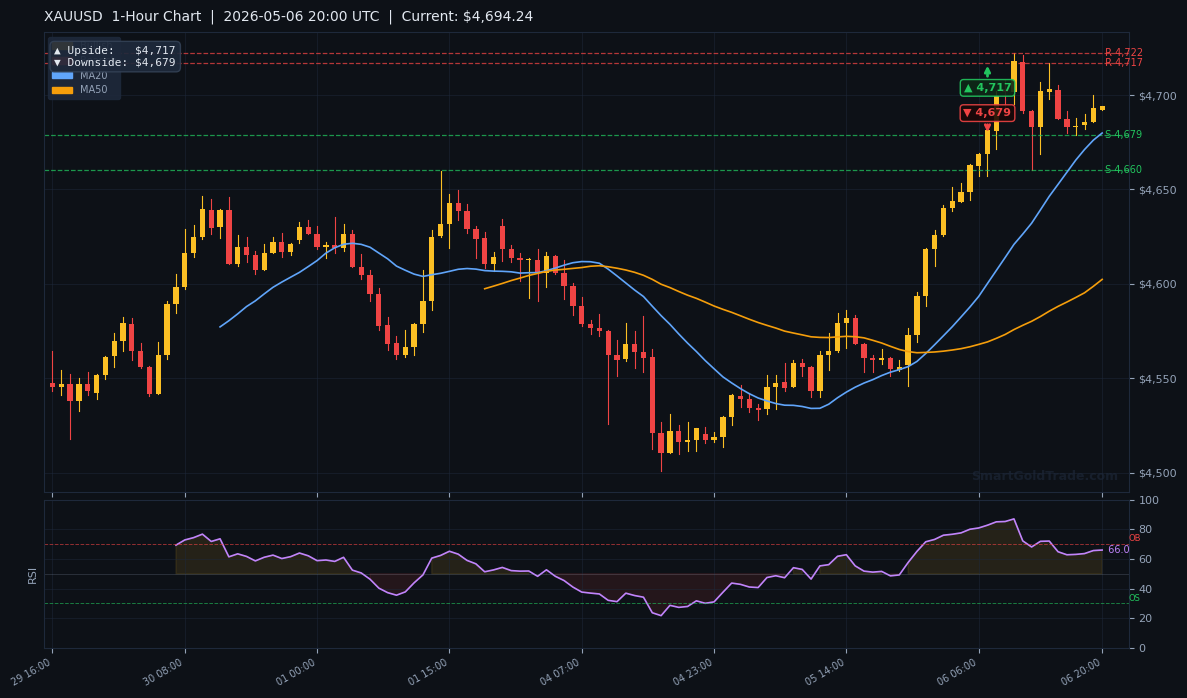
The 4-hour and 1-hour charts (above) confirm the price is consolidating within a tight range, with the 1-hour downside pivot at $4,679 closely matching the S1 support. A break below this level would open the path toward $4,667 (daily downside target).
Fundamental Drivers
The main driver today has been the resilient US economic data. Strong employment or services numbers boost the dollar and yields, applying pressure on gold. However, geopolitical uncertainty — especially in the Middle East — continues to provide a bid for safe-haven assets. The net effect is a tug-of-war that keeps the gold price locked in a range.
Key Event to Watch
While no major US data is due for the rest of the week, any unexpected Fed commentary or escalation in geopolitical tensions could break the range. Traders should monitor headlines closely, especially if the gold price approaches the $4,728 resistance or dips toward $4,667 support.
Devil's Advocate
The bullish bias is valid only as long as gold holds above $4,667. If the gold price breaks below the daily downside target of $4,667, the MA20 at $4,592 would become the next target, signaling a deeper correction. A close below the MA200 at $4,651.77 would flip the medium-term trend bearish. Watch for a catalyst — such as a sharp rally in the dollar — that could trigger that move.
Trading Strategy for American Session
For active traders, the current setup favors a buy-on-dip approach near the $4,680 support (between S1 $4,679.99 and the 1-hour downside pivot $4,679). Place a stop loss below $4,667 (daily downside target). Take profit targets: first at $4,694 (4-hour upside pivot), then $4,717 (1-hour upside target), and finally $4,728 (R1 resistance). This yields a risk-reward of approximately 1:3. For those using automated tools, consider professional gold trading signals to time entries precisely. Alternatively, for a hands-off approach, explore copy trading to follow top-performing gold traders automatically.
Key Takeaways
- Gold price is trading at $4,693.16, above all major moving averages, confirming a long-term bullish trend.
- Support at $4,679.99 (S1) and $4,669.34 (S2) must hold to maintain the bullish structure.
- Resistance stands at $4,728.36 (R1) — a break above could open a run toward $4,857 (daily upside target).
- RSI at 65.7 is neutral, allowing further upside without overbought risk.
- ATR of $20.59 suggests a likely intraday range of $4,673 to $4,714.
- A break below $4,667 would invalidate the bullish bias and target the MA20 at $4,592.
Conclusion
The gold price is at a pivotal juncture: short-term bearish pressure meets a long-term bullish trend. The $4,680 zone is the immediate battleground. If support holds, expect a grind toward $4,728. If it breaks, prepare for a deeper pullback. Stay nimble, respect the levels, and manage risk carefully.
Frequently Asked Questions
- What is the current gold price?
- The gold price is $4,693.16 as of 20:00 UTC on May 6, 2026, during the American trading session.
- What are the key support levels for gold today?
- Immediate support is at $4,679.99 (S1), followed by $4,669.34 (S2). The critical level is $4,667 (daily downside target).
- Where is the resistance for gold in the American session?
- Resistance is at $4,728.36 (R1). A break above that could target $4,857 (daily upside target).
- Is gold bullish or bearish right now?
- The long-term trend is bullish (price above MA200), but short-term pressure is bearish (MA20 below MA50). The RSI is neutral, indicating a range-bound market until a breakout occurs.
Disclaimer: Trading Gold (XAU/USD) carries significant risk of loss and is not suitable for all investors. This content is for informational purposes only and does not constitute financial advice. Always conduct your own research and trade responsibly.