Gold Price Surges After USD/CHF Breakout — Next Target $4,753
May 08, 2026 6 min read 93 views Monir Hasan
Gold price rallied sharply during the American session on Thursday, pushing to $4,726.91 as the US Dollar came under pressure following a breakdown in USD/CHF. Yesterday's move below the 0.7800 trendline extended the dollar's losing streak, providing fresh lift for XAUUSD bulls. With the metal now testing the $4,728 resistance area, traders are asking whether this rally has legs or if profit-taking will cap gains before the weekly close.
The fundamentals align: a weaker dollar, steady Treasury yields, and lingering geopolitical uncertainty all support the bid in precious metals. This session, the focus shifts to whether gold can sustain momentum above $4,680 and challenge the $4,728 handle for a breakout attempt.
Gold Price Market Overview
Macro Context
The US Dollar Index (DXY) slipped below 98.50, pressured by the Swiss franc's strength after USD/CHF broke its uptrend line. 10-year US Treasury yields remain range-bound near 4.10%, removing any rate-driven headwind for gold. The Federal Reserve's latest meeting minutes reaffirmed a cautious stance, keeping expectations of a September cut alive. Meanwhile, safe-haven demand persists amid unresolved trade tensions and Middle East instability, providing a floor under the gold price.
Session Outlook
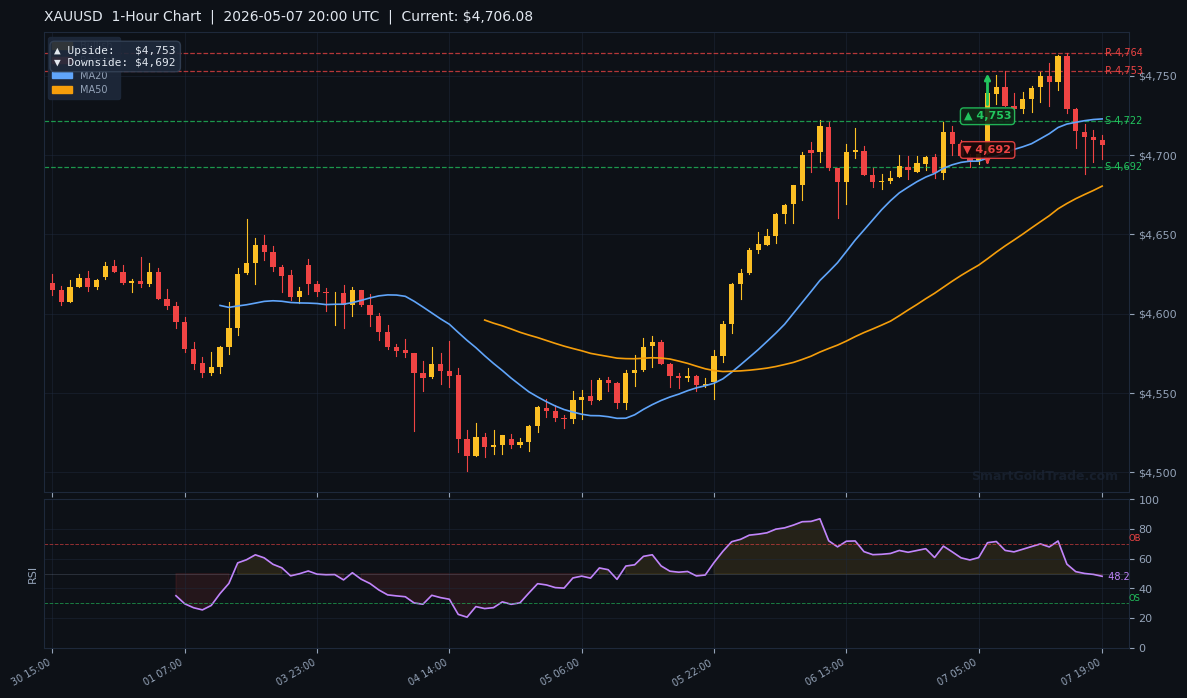
With American session liquidity in full flow, volatility is expected to hold near the daily average of $19.95 (ATR). The near-term bias is bullish as long as the metal stays above the first support at $4,679.99. A clear break above $4,728.36 (R1) could open the door to the 1-hour upside target at $4,753. Conversely, if sellers defend that level, we may see a pullback toward $4,669.34 (S2) before the next catalyst.
Technical Analysis
Moving Average Structure
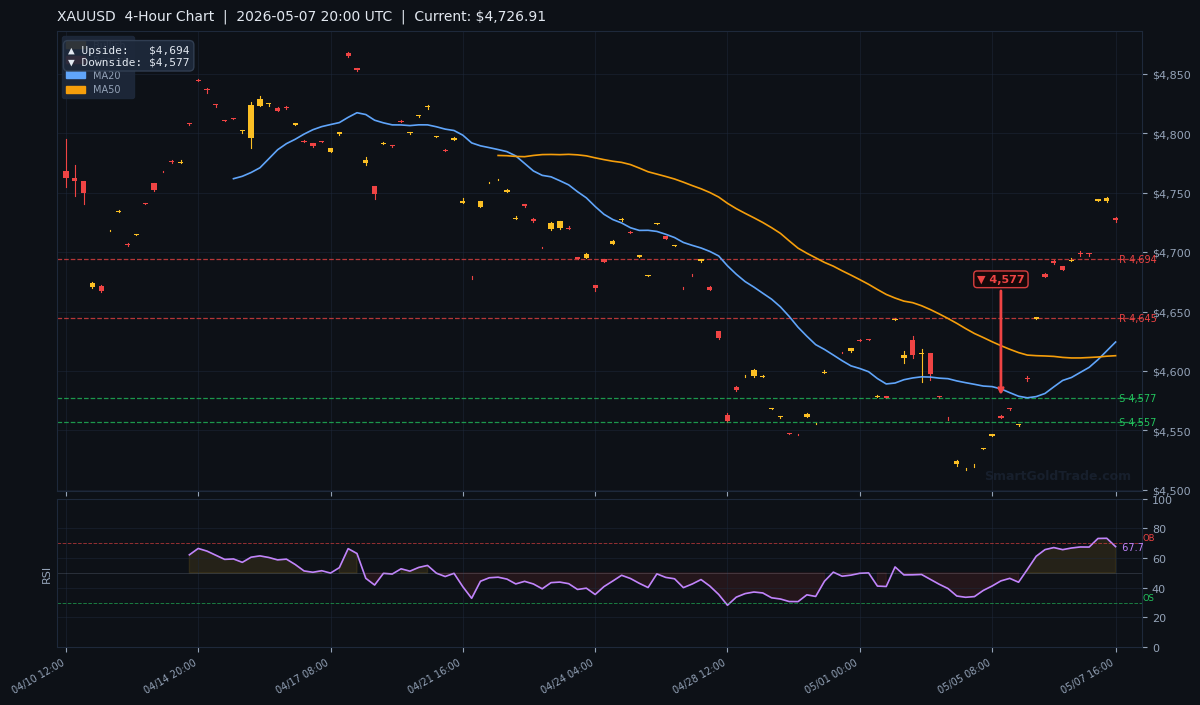
Gold price is trading well above all three key moving averages on the H4 chart. The MA20 at $4,624.36, MA50 at $4,612.85, and MA200 at $4,661.30 are all trending higher. The short-term MA20 is above the MA50, confirming a bullish crossover and sustained upward momentum. This structure strongly favours buyers and suggests any dips toward these averages should be viewed as entry opportunities rather than reversal signals.
RSI and Momentum
The 14-period RSI reads 67.7, placing it in neutral territory. This is critical: it means the market is not yet overbought, so there is plenty of room for further upside before hitting exhaustion levels above 70. Momentum indicators such as the MACD are also bullish, with the histogram expanding above zero. Traders should watch for a potential RSI drift toward 70 as the rally extends.
Key Price Levels
Level
Value
Current Price
$4,726.91
Support S1
$4,679.99
Support S2
$4,669.34
Resistance R1
$4,728.36
Resistance R2
$4,724.54
ATR (14)
$19.95
The 4-hour chart shows price consolidating near the R1 resistance while the moving average ribbon expands bullishly. A close above $4,728 would complete a bullish flag pattern targeting the daily upside pivot at $4,857. The medium-term structure favours the upside.
On the 1-hour timeframe, gold price is pressing against a descending trendline from the intraday high. A break above $4,728 would target the 1-hour upside pivot at $4,753, with the downside protection at $4,692. The H1 chart shows a series of higher lows, confirming short-term bullish momentum.
Fundamental Drivers
USD/CHF Breakdown Fuels Gold
The primary catalyst for today's rally came from the currency markets. USD/CHF breached a key support trendline near 0.7800 and extended losses, falling over 0.50% to trade at 0.7789. Traders are now targeting the March 10 swing low at 0.7748, which would imply further dollar weakness. Since gold and the dollar share a strong inverse relationship, this move gave the gold price a direct boost. Traders using halal gold trading platforms without leverage can benefit from this steady uptrend without the risk of margin calls.
Key Event to Watch
The next major test for gold comes this Thursday with the release of the US Consumer Price Index (CPI) for April. A softer inflation print would reinforce the case for Fed easing and push gold price toward $4,753 or higher. A hot number, however, could trigger a sharp reversal. Traders would be wise to tighten stops ahead of this release.
Devil's Advocate
What could derail the bullish outlook? If USD/CHF suddenly reverses back above 0.7800, the dollar would strengthen and gold could slide. The first line of defence is the support zone between $4,679.99 (S1) and $4,669.34 (S2). A break below $4,669 would suggest the rally is exhausted and open the door to the 4-hour downside target at $4,577. Additionally, if CPI prints above expectations, the resultant rate-hike fears could crush gold momentum. Until those triggers hit, the path of least resistance remains upward.
Trading Strategy for American Session
For intraday traders, the optimal entry zone lies between $4,680 and $4,700 on any pullback. Place a stop loss below $4,660 (approximately 1.5 ATR below S2) to protect against false breaks. The first take-profit target is $4,728 (R1), and a second target at $4,753 (H1 upside pivot). This setup offers a risk-reward ratio of roughly 1:2. For those following institutional moves, subscribing to professional gold trading signals can help time entries with precision. Alternatively, conservative traders can wait for a confirmed break above $4,728 with volume before adding to longs.
Key Takeaways
Gold price surged to $4,726.91 after USD/CHF broke below 0.7800 support.
Price holds above all key MAs (MA20 $4,624, MA50 $4,612, MA200 $4,661) — bull market intact.
RSI at 67.7 leaves room for further upside before overbought conditions.
Immediate resistance: $4,728 (R1) — a breakout targets $4,753 and $4,857.
Key support: $4,679.99 (S1); a break below $4,669 (S2) would negate the bullish bias.
This week's US CPI report on Thursday is the most critical fundamental catalyst.
Conclusion
The gold price is riding a strong bullish wave driven by a weakening US dollar and favourable technical positioning. As long as the metal stays above $4,679.99 support, the trend remains firmly in favour of buyers. The next upside targets are $4,728 and $4,753, backed by a neutral RSI and a well-structured moving average setup. Thursday's CPI report will decide whether this rally extends or corrects. For now, the American session bias is bullish.
Frequently Asked Questions
What is the current gold price?
The gold price is trading at $4,726.91 per troy ounce as of 19:58 UTC on May 7, 2026.
Where is the key support level for gold today?
The first support is at $4,679.99 (S1), with a stronger floor at $4,669.34 (S2).
Is the gold market overbought?
No, the RSI is at 67.7, which is in neutral territory, meaning there is room for further gains without being overextended.
What happens if gold breaks above $4,728?
A break above $4,728 resistance targets the 1-hour upside pivot at $4,753 and later the daily pivot at $4,857.
How does the USD/CHF move affect gold?
The USD/CHF breakdown signals broad dollar weakness, which directly boosts the gold price due to the inverse relationship. A further move toward 0.7748 would likely push gold higher.
Trading Gold (XAU/USD) carries significant risk of loss and is not suitable for all investors. This content is for informational purposes only and does not constitute financial advice. Always conduct your own research and trade responsibly.