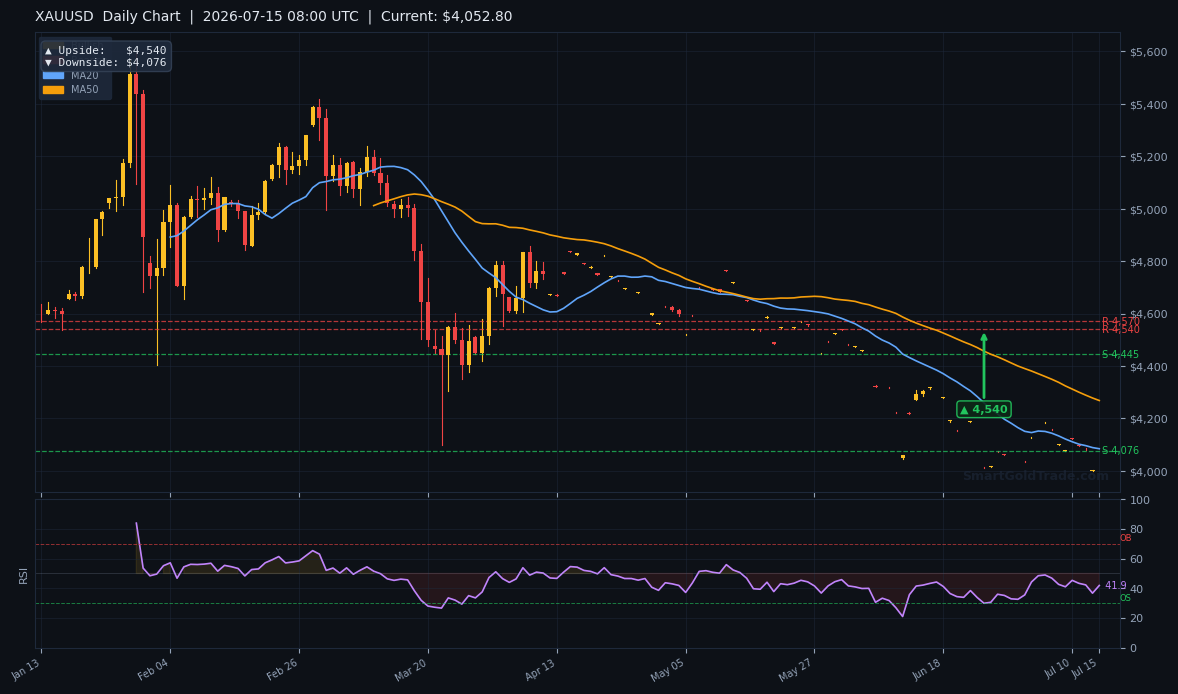
Gold price plunged to $4,032.68 in early European trading on Tuesday, with selling momentum accelerating after last week’s US CPI data firmed the dollar. Sharply higher oil prices — driven by US–Iran tensions and slowing vessel traffic through the Strait of Hormuz — are injecting a geopolitical risk premium into markets, yet gold has struggled to attract safe‑haven bids. As London traders enter the fray, the $4,000 psychological level now looks like the next magnet for bears.
Gold Price Market Overview
Macro Context
The US Dollar Index (DXY) firmed above 104.5 after June’s Consumer Price Index beat forecasts, pushing 10‑year Treasury yields back above 4.30%. The Federal Reserve’s hawkish tone has slashed rate‑cut expectations, depriving non‑yielding gold of support. Meanwhile, ING strategists Warren Patterson and Ewa Manthey noted that sharply higher oil prices — fuelled by US‑Iran escalation and disrupted Hormuz traffic — are raising stagflation fears, but gold’s typical safe‑haven allure is being overridden by dollar strength.
Session Outlook
The European session is likely to extend the bearish trend as London liquidity amplifies moves. With the metal trading below every major moving average, rallies toward $4,060 will attract fresh sellers. Intraday ATR(14) of $15.69 suggests a probable range of $4,016–$4,048. A clean break below $4,030 would open the door to a rapid test of the $4,000 round figure, a level that bulls must defend to avoid a deeper washout.
Gold Price Technical Analysis
Moving Average Structure
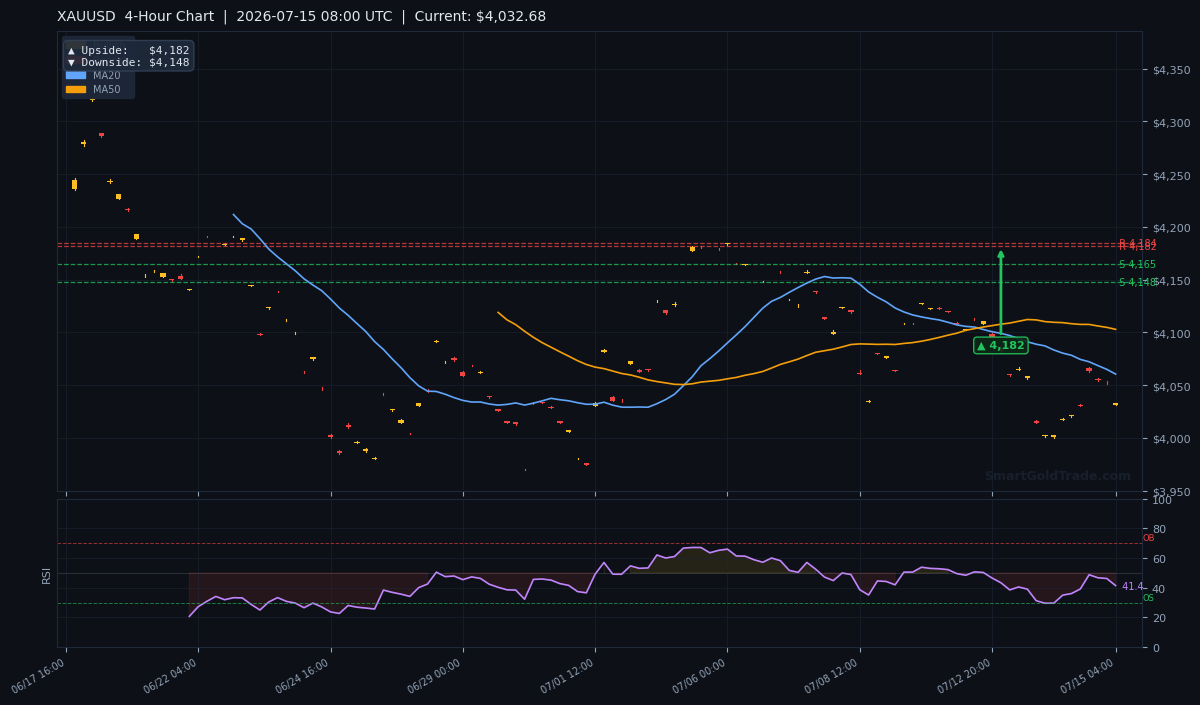
XAU/USD is trading at $4,032.68, well beneath the 20‑period MA at $4,060.47, the 50‑MA at $4,102.86, and the 200‑MA at $4,198.20. This death‑cross configuration — where the short‑term MA20 sits below the MA50 — underscores a firmly bearish trend. Price action is carving lower highs and lower lows, and every attempt to reclaim the MA20 has been met with aggressive selling.
RSI and Momentum
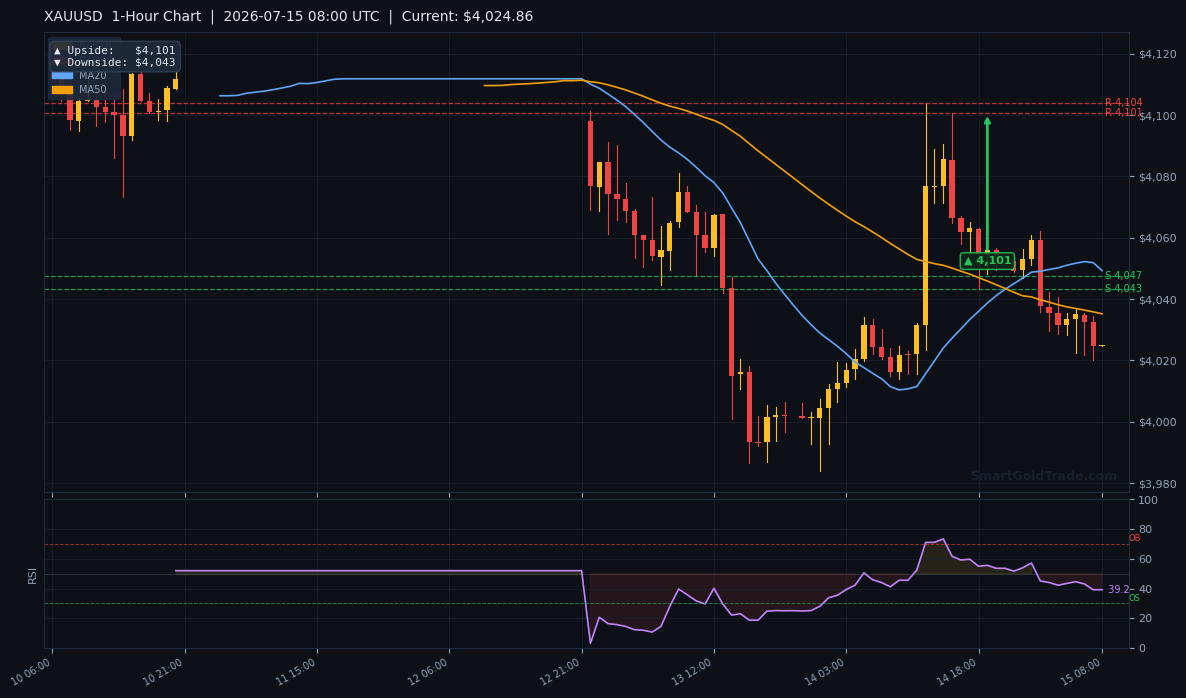
The 14‑period RSI stands at 41.5, clinging to neutral territory but sloping lower. There is still plenty of room before oversold territory (<30) is reached, meaning momentum can sustain further decline without triggering a mechanical bounce. A drop below 40 would confirm intensifying bearish momentum and likely accelerate the move toward $4,000.
Key Price Levels
Former support levels S1 ($4,164.51) and S2 ($4,147.61) have decisively flipped to resistance. Any intraday recovery will face selling pressure at $4,060 (MA20) and $4,101 (1‑hour upside target). Downside, the 1‑hour target of $4,043 has already been breached, shifting focus to the 4‑hour downside target of $4,148 — though price is well below that, signalling a larger trend breakdown. The next structural floor sits at $4,000, with a secondary line at $3,980.
An ATR‑based expected range for the European session extends from $4,016.99 to $4,048.37, meaning a breach of either boundary would represent a statistically unusual move.
| Timeframe | Upside Target | Downside Target |
|---|---|---|
| Daily | $4,540 | $4,076 |
| 4-Hour | $4,182 | $4,148 |
| 1-Hour | $4,101 | $4,043 |
Fundamental Drivers
The two dominant forces shaping the market right now are a firming US dollar and escalating Middle Eastern tensions. Last week’s CPI print of 3.4% year‑on‑year reinforced the Fed’s resolve to keep rates higher for longer, sending the DXY index to multi‑week highs and punishing gold. At the same time, Brent crude jumped above $90 as Iran‑linked disruptions in the Strait of Hormuz raised supply‑shock fears — but the resulting risk‑aversion has flowed into the dollar and US bonds, not gold. This atypical decoupling suggests that dollar‑strength momentum is temporarily overpowering geopolitical safe‑haven demand.
While the gold price usually climbs alongside oil spikes due to inflation and geopolitical risk, this time the correlation has broken. The dollar’s muscle is so dominant that the gold price is being pushed lower despite the oil crisis. For traders monitoring the gold price, keeping a close eye on the DXY remains just as critical as watching crude charts.
Key Event to Watch
The US Retail Sales report due on Thursday, July 17, will be this week’s pivotal trigger. A strong number would reinforce the ‘higher for longer’ rate narrative and likely send gold below $4,000. Conversely, a miss could dent the dollar and spark a relief rally toward $4,060. Given that the gold price is already testing the psychological $4,000 floor, a hot retail sales print could shatter it quickly. Traders should also monitor any sudden escalation in the Strait of Hormuz; a full closure could override the dollar correlation and ignite a rapid flight into gold.
What the Gold Price Means for Shariah‑Compliant Traders
For Muslims who want to benefit from gold price moves without earning riba, using a platform that offers halal gold trading is essential. SmartGoldTrade’s spot model ensures you own the underlying metal outright — no interest, no leverage, and no speculative CFDs. As the gold price tests $4,000, short‑term traders following our analysis can execute precise entries in a fully Shariah‑compliant manner.
Longer‑term investors might consider allocating through Shariah‑compliant gold investment pools, which share profits from physical gold holdings rather than betting on derivative contracts. With the gold price potentially finding a floor, these pools offer a way to participate in any upside while staying squarely within Islamic finance principles.
Devil’s Advocate
A sudden de‑escalation between Washington and Tehran — or an explicit military stand‑down — could calm oil markets and remove the geopolitical fear factor. In that scenario, gold’s bearish momentum would persist but likely slow. The real reversal scenario, however, would be a combination of weak US Retail Sales and a dovish Fedspeak that reignites rate‑cut bets. That would lift gold back above the $4,060 MA20, invalidating the current downtrend and setting up a retest of $4,148 (former support now resistance). If weak data and a dovish surprise materialise, the gold price could rally sharply in a short squeeze. A daily close above $4,060 is the level to watch for a trend shift.
Trading Strategy for European Session
Short setups remain the dominant play. Use the $4,055–$4,065 zone as an entry window on any intraday bounce toward the MA20. Place a stop loss at $4,080 — roughly 1.5 times the ATR — to account for volatility spikes. First take‑profit target is $4,000, with a secondary target at $3,980 for a 1:2 risk‑reward profile. Aggressive traders can short a clean break below $4,025 with a similarly tight stop.
For those who prefer to follow seasoned professionals, copy trading can help execute these same setups without manual execution. For real‑time alerts on key levels, professional gold trading signals provide entry and exit guidance.
Key Takeaways
- Gold price is trading at $4,032.68, below all major moving averages, signalling a strong bear trend.
- RSI at 41.5 leaves room for further downside before oversold conditions trigger a bounce.
- ATR of $15.69 projects a session range of $4,016–$4,048 — a break below $4,016 would accelerate selling.
- Former supports S1 ($4,164.51) and S2 ($4,147.61) now act as overhead resistance.
- Key support sits at $4,000 (psychological) and $3,980; a breach could extend losses to $3,900.
- A daily close above $4,060 (MA20) would flip the bias to neutral and open a path to $4,148.
- Long‑term holders can mitigate risk by diversifying into physical gold, which remains a tangible hedge against fiat currency.
Conclusion
Gold price momentum remains firmly bearish as the European session unfolds, with the metal pinned below every key moving average. The convergence of a strong US dollar, hawkish Fed outlook, and oil‑driven risk aversion that is bypassing gold creates a toxic mix for longs. As long as XAU/USD trades beneath $4,060, the path of least resistance points to $4,000. A breach of that floor is likely to trigger stop‑loss cascades and force a retest of the $3,980 low. However, traders must remain nimble; an unexpected geopolitical shock in the Strait of Hormuz could swiftly remodel the landscape and send gold screaming back toward $4,148.
FAQ
- What is driving gold price lower despite escalating Iran tensions?
- The stronger US dollar, buoyed by last week’s hot CPI reading and hawkish Fed rhetoric, is overwhelming gold’s typical safe‑haven appeal. Oil is rising, but gold is being sold as real yields climb.
- Where is the next key support for XAU/USD?
- The immediate support is the psychological $4,000 level, followed by $3,980. A clean break below $4,000 could trigger acceleration toward $3,900.
- What level would invalidate the bearish outlook?
- A daily close above the 20‑period MA at $4,060 would suggest sellers are losing momentum and could shift the bias to consolidation or a short‑squeeze rally.
Trading Gold (XAU/USD) carries significant risk of loss and is not suitable for all investors. This content is for informational purposes only and does not constitute financial advice. Always conduct your own research and trade responsibly.