
Gold price is holding near $4,718.90 during the early Asian session on May 13, 2026, maintaining its position above key moving averages. While the short-term structure remains bullish, a closer look at the technical indicators reveals a neutral RSI reading and thinning liquidity that could trigger a retracement to $4,683 support. Traders should prepare for a potential pullback rather than chasing the rally.
Gold Market Overview
Macro Context
West Texas Intermediate crude oil rose to around $95.70 during Tuesday's Asian hours, fueled by renewed geopolitical tensions in the Middle East. This safe-haven bid has provided a tailwind for gold price, but the move appears partially priced in. The US Dollar Index remains subdued, while markets continue to price in a potential Fed pause later this year. The combination of geopolitical risk and dollar weakness supports gold, yet the quiet Asian session often reduces momentum.
Session Outlook
Asian session liquidity is thin, which typically amplifies false breakouts and sudden reversals. For gold price, the likely range today is between nearest support at $4,702.94 and resistance at $4,745.97. Traders should watch for a retest of the $4,703 area before any directional move develops. A sustained break above $4,746 would signal renewed bullish intent, but the contrarian case for a pullback to $4,683 remains strong given the neutral RSI.
Technical Analysis
Moving Average Structure
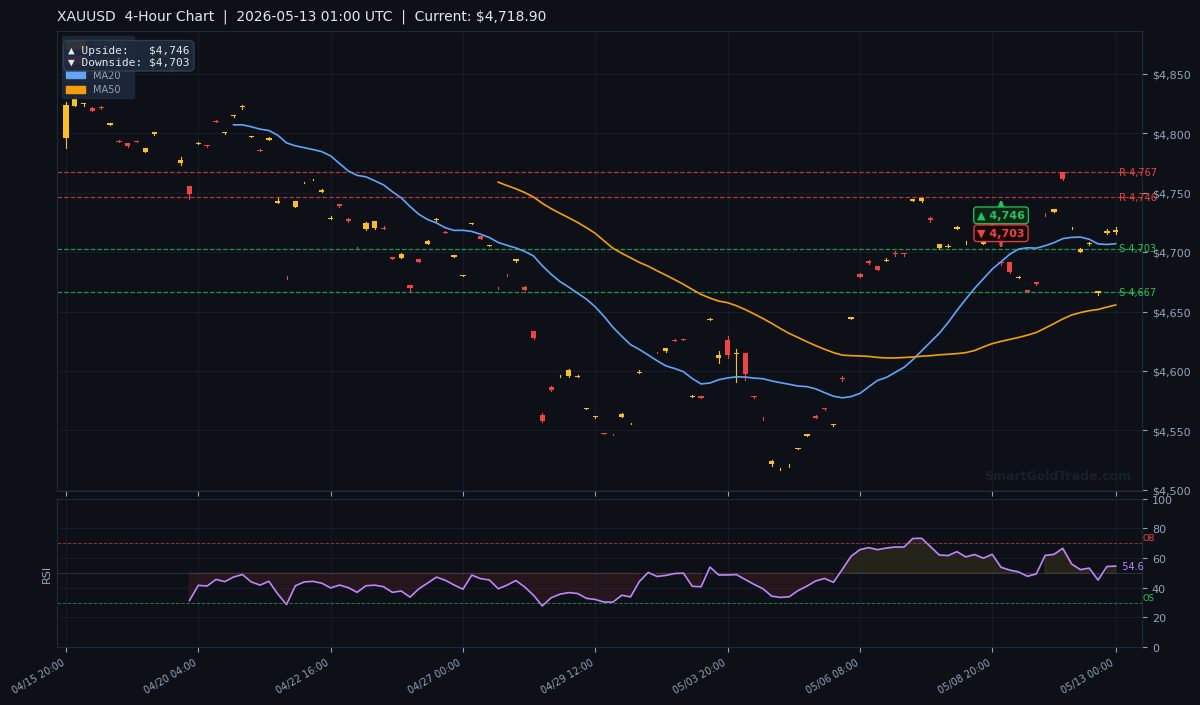
The MA20 sits at $4,707.00, the MA50 at $4,655.56, and the MA200 at $4,687.49. Gold price is currently above all three, confirming a bull market across timeframes. The short-term structure is particularly supportive because MA20 is above MA50, indicating accelerating momentum. However, the price is only $11.90 above the MA20, leaving limited buffer for a dip.
RSI and Momentum
The RSI(14) reads 54.6, sitting in neutral territory. This is neither overbought nor oversold, but it suggests that recent buying pressure has not yet reached exhaustion. In thin liquidity, a neutral RSI often precedes a sharp move in either direction. Given that gold price has rallied from the MA200 level without a significant retracement, the probabilistic edge leans toward a pullback toward support.
Key Price Levels
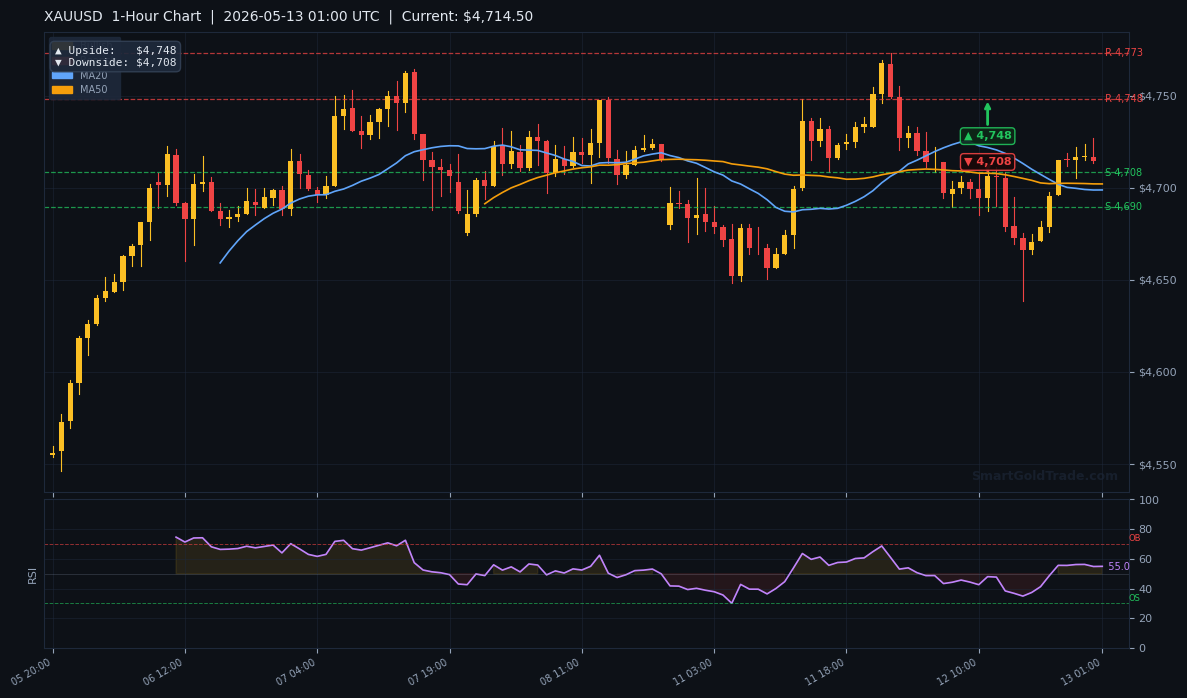
Using the daily pivot arrows from the charts, the upside target is $4,838 and the downside target is $4,683. On the 4-hour chart, the upside pivot sits at $4,746 and the downside at $4,703. The 1-hour chart shows similarly tight levels: upside $4,748, downside $4,708. The ATR(14) is $23.82, implying an expected range of roughly $47 during a normal day. Levels provided by the indicators: Support S1 $4,702.94, Support S2 $4,666.72, Resistance R1 $4,767.25, Resistance R2 $4,745.97.
| Timeframe | Upside Target | Downside Target |
|---|---|---|
| Daily | $4,838 | $4,683 |
| 4-Hour | $4,746 | $4,703 |
| 1-Hour | $4,748 | $4,708 |
Fundamental Drivers
Key Event to Watch
Renewed geopolitical tensions in the Middle East have boosted crude oil, and gold price has followed suit as a safe haven. However, the market has already absorbed this news, and further upside may be limited unless there is a tangible escalation. This week, the most important event for gold is the US dollar direction. A continued dollar slide would push gold price toward the daily upside target of $4,838, while any dollar strength could accelerate the pullback to $4,683.
Devil's Advocate
The contrarian bearish bias could be invalidated if gold price closes a 4-hour candle above $4,767.25 (R1 resistance). A breakout above that level would signal that buyers are absorbing sell orders, likely propelling the price toward $4,838. Additionally, a surprise drop in the US dollar or a fresh geopolitical crisis could ignite another rally. Traders should use a stop-loss above $4,770 to protect short positions.
Trading Strategy for Asian Session
Given the neutral RSI and thin liquidity, the highest-probability trade is to sell gold price near the resistance cluster of $4,745–$4,748 (4H and 1H upside targets). Place a stop-loss at $4,775 (above R1). The first take-profit target is $4,703 (4H downside pivot), and the second is $4,683 (daily downside target). This gives a risk-reward ratio of roughly 1:2. Alternatively, aggressive traders can wait for a breakdown below $4,703 and short with a target of $4,683. For precise entr<0xE9>es, consider using professional gold trading signals that provide real-time alerts. For those seeking a long-term halal approach, explore our Shariah-compliant spot gold trading platform.
Key Takeaways
- Gold price is currently at $4,718.90, above MA20 ($4,707), MA50 ($4,655.56), and MA200 ($4,687.49).
- RSI(14) at 54.6 is neutral, suggesting potential for a pullback.
- Immediate resistance is $4,745.97 (R2) and $4,767.25 (R1).
- Key support is $4,702.94 (S1), with a major downside target at $4,683.
- An ATR of $23.82 indicates a normal daily range of about $48.
- Bulls need to hold above $4,703 to maintain short-term momentum; a break below opens the door to $4,683.
Conclusion
Gold price remains in a bullish macro trend, but the Asian session's thin liquidity and neutral RSI suggest a near-term retracement to $4,683 is the more probable scenario. Traders should avoid chasing the current levels and instead wait for a sell-off toward support before re-entering longs. Keep a close watch on the $4,703 level – a clean break below it confirms the pullback. If you're looking for a riba-free trading environment, interest-free spot gold trading is available through our platform. For now, patience and preparation are your best tools.
Frequently Asked Questions
- What is the gold price today?
- As of May 13, 2026, during the Asian session, gold price is trading at $4,718.90 per troy ounce.
- What is the next support level for gold?
- The immediate support is $4,702.94 (S1). A break below that targets $4,683 on the daily chart.
- Is gold bullish or bearish this week?
- The medium-term trend is bullish (price above all major MAs), but short-term momentum is neutral. A retracement to $4,683 is likely before further upside.
- What is the RSI indicating for gold right now?
- RSI(14) is at 54.6, neutral. It indicates that gold is neither overbought nor oversold, leaving room for both directions.
Trading Gold (XAU/USD) carries significant risk of loss and is not suitable for all investors. This content is for informational purposes only and does not constitute financial advice. Always conduct your own research and trade responsibly.